
Advertisement
- United States
- /
- Biotech
- /
- NasdaqGS:PBYI
Is There An Opportunity With Puma Biotechnology, Inc.'s (NASDAQ:PBYI) 46% Undervaluation?
Key Insights
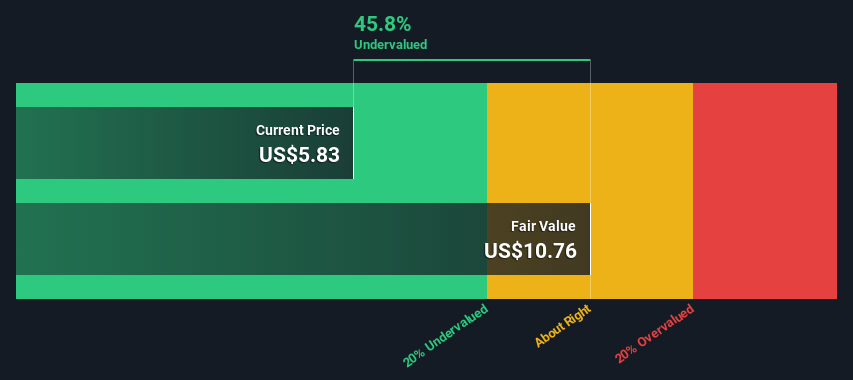
- Puma Biotechnology's estimated fair value is US$10.76 based on 2 Stage Free Cash Flow to Equity
- Current share price of US$5.83 suggests Puma Biotechnology is potentially 46% undervalued
- When compared to theindustry average discount to fair value of 41%, Puma Biotechnology's competitors seem to be trading at a lesser discount
Today we'll do a simple run through of a valuation method used to estimate the attractiveness of Puma Biotechnology, Inc. (NASDAQ:PBYI) as an investment opportunity by taking the expected future cash flows and discounting them to their present value. We will take advantage of the Discounted Cash Flow (DCF) model for this purpose. Don't get put off by the jargon, the math behind it is actually quite straightforward.
Companies can be valued in a lot of ways, so we would point out that a DCF is not perfect for every situation. For those who are keen learners of equity analysis, the Simply Wall St analysis model here may be something of interest to you.
See our latest analysis for Puma Biotechnology
Crunching The Numbers
We are going to use a two-stage DCF model, which, as the name states, takes into account two stages of growth. The first stage is generally a higher growth period which levels off heading towards the terminal value, captured in the second 'steady growth' period. To start off with, we need to estimate the next ten years of cash flows. Where possible we use analyst estimates, but when these aren't available we extrapolate the previous free cash flow (FCF) from the last estimate or reported value. We assume companies with shrinking free cash flow will slow their rate of shrinkage, and that companies with growing free cash flow will see their growth rate slow, over this period. We do this to reflect that growth tends to slow more in the early years than it does in later years.
Generally we assume that a dollar today is more valuable than a dollar in the future, so we discount the value of these future cash flows to their estimated value in today's dollars:
10-year free cash flow (FCF) forecast
| 2024 | 2025 | 2026 | 2027 | 2028 | 2029 | 2030 | 2031 | 2032 | 2033 | |
| Levered FCF ($, Millions) | US$46.0m | US$47.0m | US$42.0m | US$36.0m | US$30.0m | US$27.1m | US$25.5m | US$24.6m | US$24.1m | US$24.0m |
| Growth Rate Estimate Source | Analyst x1 | Analyst x1 | Analyst x1 | Analyst x1 | Analyst x1 | Est @ -9.61% | Est @ -6.04% | Est @ -3.54% | Est @ -1.79% | Est @ -0.57% |
| Present Value ($, Millions) Discounted @ 6.9% | US$43.0 | US$41.2 | US$34.4 | US$27.6 | US$21.5 | US$18.2 | US$16.0 | US$14.5 | US$13.3 | US$12.4 |
("Est" = FCF growth rate estimated by Simply Wall St)
Present Value of 10-year Cash Flow (PVCF) = US$242m
After calculating the present value of future cash flows in the initial 10-year period, we need to calculate the Terminal Value, which accounts for all future cash flows beyond the first stage. The Gordon Growth formula is used to calculate Terminal Value at a future annual growth rate equal to the 5-year average of the 10-year government bond yield of 2.3%. We discount the terminal cash flows to today's value at a cost of equity of 6.9%.
Terminal Value (TV)= FCF2033 × (1 + g) ÷ (r – g) = US$24m× (1 + 2.3%) ÷ (6.9%– 2.3%) = US$537m
Present Value of Terminal Value (PVTV)= TV / (1 + r)10= US$537m÷ ( 1 + 6.9%)10= US$277m
The total value, or equity value, is then the sum of the present value of the future cash flows, which in this case is US$519m. The last step is to then divide the equity value by the number of shares outstanding. Compared to the current share price of US$5.8, the company appears quite undervalued at a 46% discount to where the stock price trades currently. The assumptions in any calculation have a big impact on the valuation, so it is better to view this as a rough estimate, not precise down to the last cent.
The Assumptions
Now the most important inputs to a discounted cash flow are the discount rate, and of course, the actual cash flows. If you don't agree with these result, have a go at the calculation yourself and play with the assumptions. The DCF also does not consider the possible cyclicality of an industry, or a company's future capital requirements, so it does not give a full picture of a company's potential performance. Given that we are looking at Puma Biotechnology as potential shareholders, the cost of equity is used as the discount rate, rather than the cost of capital (or weighted average cost of capital, WACC) which accounts for debt. In this calculation we've used 6.9%, which is based on a levered beta of 0.993. Beta is a measure of a stock's volatility, compared to the market as a whole. We get our beta from the industry average beta of globally comparable companies, with an imposed limit between 0.8 and 2.0, which is a reasonable range for a stable business.
SWOT Analysis for Puma Biotechnology
Strength
- Earnings growth over the past year exceeded the industry.
- Debt is not viewed as a risk.
Weakness
- Shareholders have been diluted in the past year.
Opportunity
- Trading below our estimate of fair value by more than 20%.
Threat
- No apparent threats visible for PBYI.
Looking Ahead:
Although the valuation of a company is important, it shouldn't be the only metric you look at when researching a company. DCF models are not the be-all and end-all of investment valuation. Preferably you'd apply different cases and assumptions and see how they would impact the company's valuation. For instance, if the terminal value growth rate is adjusted slightly, it can dramatically alter the overall result. What is the reason for the share price sitting below the intrinsic value? For Puma Biotechnology, we've compiled three relevant aspects you should consider:
- Risks: For instance, we've identified 3 warning signs for Puma Biotechnology (1 shouldn't be ignored) you should be aware of.
- Future Earnings: How does PBYI's growth rate compare to its peers and the wider market? Dig deeper into the analyst consensus number for the upcoming years by interacting with our free analyst growth expectation chart.
- Other High Quality Alternatives: Do you like a good all-rounder? Explore our interactive list of high quality stocks to get an idea of what else is out there you may be missing!
PS. Simply Wall St updates its DCF calculation for every American stock every day, so if you want to find the intrinsic value of any other stock just search here.
New: Manage All Your Stock Portfolios in One Place
We've created the ultimate portfolio companion for stock investors, and it's free.
• Connect an unlimited number of Portfolios and see your total in one currency
• Be alerted to new Warning Signs or Risks via email or mobile
• Track the Fair Value of your stocks
Have feedback on this article? Concerned about the content? Get in touch with us directly. Alternatively, email editorial-team (at) simplywallst.com.
This article by Simply Wall St is general in nature. We provide commentary based on historical data and analyst forecasts only using an unbiased methodology and our articles are not intended to be financial advice. It does not constitute a recommendation to buy or sell any stock, and does not take account of your objectives, or your financial situation. We aim to bring you long-term focused analysis driven by fundamental data. Note that our analysis may not factor in the latest price-sensitive company announcements or qualitative material. Simply Wall St has no position in any stocks mentioned.
About NasdaqGS:PBYI
Puma Biotechnology
A biopharmaceutical company, focuses on the development and commercialization of products to enhance cancer care in the United States and internationally.
Outstanding track record with flawless balance sheet.
Similar Companies
Market Insights


Advertisement
Community Narratives
The Next Phase of Defense AI: A Robotic Response to America’s Security Gaps
Fair Value US$12.00|54.3% undervalued
MA
Community Contributor
Figma (FIG): The S&P 500’s Design Standard Turning Into an All-in-One Platform
Fair Value US$65.70|7.2% overvalued
TI
Community Contributor
Sleep Cycle's Revenue Set to Rise 10% with Strong Revenue Model
Fair Value SEK 38.04|24.6% undervalued
MA
Community Contributor
Has JB Hi-Fi Lost Its Point of Difference?
Fair Value AU$76.00|51.4% overvalued
RO
Community Contributor