- United States
- /
- Biotech
- /
- NasdaqGS:KNSA
Kiniksa Pharmaceuticals International, plc (NASDAQ:KNSA) Surges 25% Yet Its Low P/S Is No Reason For Excitement


Kiniksa Pharmaceuticals International, plc (NASDAQ:KNSA) shares have had a really impressive month, gaining 25% after a shaky period beforehand. The last 30 days bring the annual gain to a very sharp 36%.
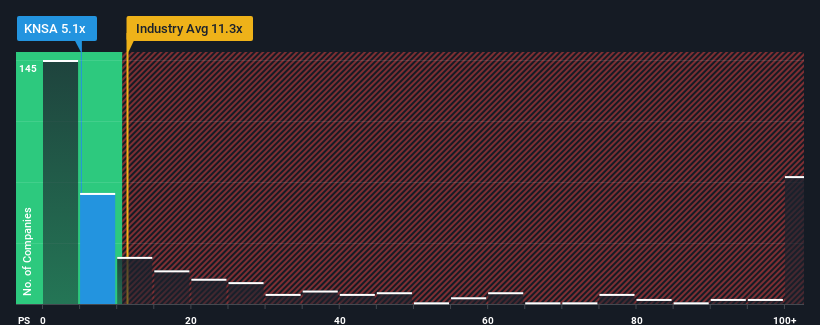
In spite of the firm bounce in price, Kiniksa Pharmaceuticals International's price-to-sales (or "P/S") ratio of 5.1x might still make it look like a strong buy right now compared to the wider Biotechs industry in the United States, where around half of the companies have P/S ratios above 11.3x and even P/S above 63x are quite common. However, the P/S might be quite low for a reason and it requires further investigation to determine if it's justified.
Check out our latest analysis for Kiniksa Pharmaceuticals International
What Does Kiniksa Pharmaceuticals International's Recent Performance Look Like?
Recent times haven't been great for Kiniksa Pharmaceuticals International as its revenue has been rising slower than most other companies. The P/S ratio is probably low because investors think this lacklustre revenue performance isn't going to get any better. If you still like the company, you'd be hoping revenue doesn't get any worse and that you could pick up some stock while it's out of favour.
Keen to find out how analysts think Kiniksa Pharmaceuticals International's future stacks up against the industry? In that case, our free report is a great place to start.Is There Any Revenue Growth Forecasted For Kiniksa Pharmaceuticals International?
The only time you'd be truly comfortable seeing a P/S as depressed as Kiniksa Pharmaceuticals International's is when the company's growth is on track to lag the industry decidedly.
If we review the last year of revenue growth, the company posted a terrific increase of 21%. This great performance means it was also able to deliver immense revenue growth over the last three years. Accordingly, shareholders would have been over the moon with those medium-term rates of revenue growth.
Turning to the outlook, the next three years should generate growth of 29% per year as estimated by the six analysts watching the company. That's shaping up to be materially lower than the 176% per year growth forecast for the broader industry.
With this information, we can see why Kiniksa Pharmaceuticals International is trading at a P/S lower than the industry. Apparently many shareholders weren't comfortable holding on while the company is potentially eyeing a less prosperous future.
The Key Takeaway
Even after such a strong price move, Kiniksa Pharmaceuticals International's P/S still trails the rest of the industry. Typically, we'd caution against reading too much into price-to-sales ratios when settling on investment decisions, though it can reveal plenty about what other market participants think about the company.
As we suspected, our examination of Kiniksa Pharmaceuticals International's analyst forecasts revealed that its inferior revenue outlook is contributing to its low P/S. At this stage investors feel the potential for an improvement in revenue isn't great enough to justify a higher P/S ratio. The company will need a change of fortune to justify the P/S rising higher in the future.
A lot of potential risks can sit within a company's balance sheet. You can assess many of the main risks through our free balance sheet analysis for Kiniksa Pharmaceuticals International with six simple checks.
If companies with solid past earnings growth is up your alley, you may wish to see this free collection of other companies with strong earnings growth and low P/E ratios.
If you're looking to trade Kiniksa Pharmaceuticals International, open an account with the lowest-cost platform trusted by professionals, Interactive Brokers.
With clients in over 200 countries and territories, and access to 160 markets, IBKR lets you trade stocks, options, futures, forex, bonds and funds from a single integrated account.
Enjoy no hidden fees, no account minimums, and FX conversion rates as low as 0.03%, far better than what most brokers offer.
Sponsored ContentValuation is complex, but we're here to simplify it.
Discover if Kiniksa Pharmaceuticals International might be undervalued or overvalued with our detailed analysis, featuring fair value estimates, potential risks, dividends, insider trades, and its financial condition.
Access Free AnalysisHave feedback on this article? Concerned about the content? Get in touch with us directly. Alternatively, email editorial-team (at) simplywallst.com.
This article by Simply Wall St is general in nature. We provide commentary based on historical data and analyst forecasts only using an unbiased methodology and our articles are not intended to be financial advice. It does not constitute a recommendation to buy or sell any stock, and does not take account of your objectives, or your financial situation. We aim to bring you long-term focused analysis driven by fundamental data. Note that our analysis may not factor in the latest price-sensitive company announcements or qualitative material. Simply Wall St has no position in any stocks mentioned.
Have feedback on this article? Concerned about the content? Get in touch with us directly. Alternatively, email editorial-team@simplywallst.com
About NasdaqGS:KNSA
Kiniksa Pharmaceuticals International
A biopharmaceutical company, developing and commercializing novel therapies for diseases with unmet need and focuses on cardiovascular indications worldwide.
Very undervalued with flawless balance sheet.

