- United States
- /
- Biotech
- /
- NasdaqGS:HALO
Halozyme Therapeutics, Inc.'s (NASDAQ:HALO) Intrinsic Value Is Potentially 97% Above Its Share Price


Key Insights
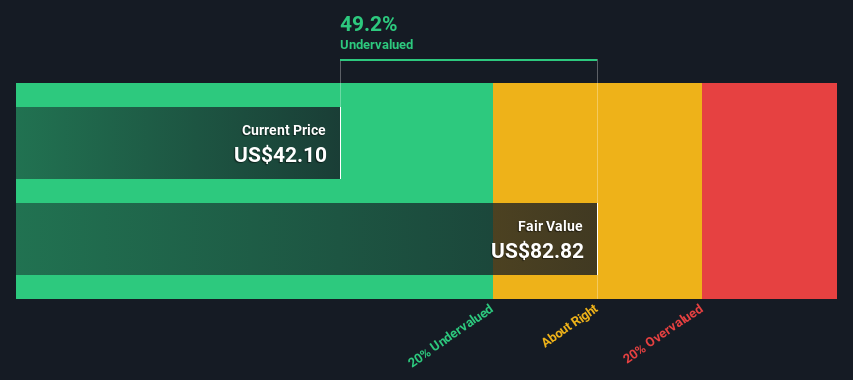
- Using the 2 Stage Free Cash Flow to Equity, Halozyme Therapeutics fair value estimate is US$82.82
- Halozyme Therapeutics' US$42.10 share price signals that it might be 49% undervalued
- The US$51.27 analyst price target for HALO is 38% less than our estimate of fair value
Does the December share price for Halozyme Therapeutics, Inc. (NASDAQ:HALO) reflect what it's really worth? Today, we will estimate the stock's intrinsic value by projecting its future cash flows and then discounting them to today's value. We will take advantage of the Discounted Cash Flow (DCF) model for this purpose. It may sound complicated, but actually it is quite simple!
Remember though, that there are many ways to estimate a company's value, and a DCF is just one method. Anyone interested in learning a bit more about intrinsic value should have a read of the Simply Wall St analysis model.
See our latest analysis for Halozyme Therapeutics
Step By Step Through The Calculation
We are going to use a two-stage DCF model, which, as the name states, takes into account two stages of growth. The first stage is generally a higher growth period which levels off heading towards the terminal value, captured in the second 'steady growth' period. In the first stage we need to estimate the cash flows to the business over the next ten years. Where possible we use analyst estimates, but when these aren't available we extrapolate the previous free cash flow (FCF) from the last estimate or reported value. We assume companies with shrinking free cash flow will slow their rate of shrinkage, and that companies with growing free cash flow will see their growth rate slow, over this period. We do this to reflect that growth tends to slow more in the early years than it does in later years.
Generally we assume that a dollar today is more valuable than a dollar in the future, and so the sum of these future cash flows is then discounted to today's value:
10-year free cash flow (FCF) estimate
| 2024 | 2025 | 2026 | 2027 | 2028 | 2029 | 2030 | 2031 | 2032 | 2033 | |
| Levered FCF ($, Millions) | US$455.5m | US$464.0m | US$472.6m | US$481.9m | US$491.8m | US$502.1m | US$512.8m | US$523.8m | US$535.2m | US$547.0m |
| Growth Rate Estimate Source | Analyst x2 | Analyst x1 | Est @ 1.86% | Est @ 1.97% | Est @ 2.04% | Est @ 2.10% | Est @ 2.13% | Est @ 2.16% | Est @ 2.18% | Est @ 2.19% |
| Present Value ($, Millions) Discounted @ 6.3% | US$428 | US$410 | US$393 | US$377 | US$362 | US$347 | US$334 | US$321 | US$308 | US$296 |
("Est" = FCF growth rate estimated by Simply Wall St)
Present Value of 10-year Cash Flow (PVCF) = US$3.6b
We now need to calculate the Terminal Value, which accounts for all the future cash flows after this ten year period. The Gordon Growth formula is used to calculate Terminal Value at a future annual growth rate equal to the 5-year average of the 10-year government bond yield of 2.2%. We discount the terminal cash flows to today's value at a cost of equity of 6.3%.
Terminal Value (TV)= FCF2033 × (1 + g) ÷ (r – g) = US$547m× (1 + 2.2%) ÷ (6.3%– 2.2%) = US$14b
Present Value of Terminal Value (PVTV)= TV / (1 + r)10= US$14b÷ ( 1 + 6.3%)10= US$7.4b
The total value, or equity value, is then the sum of the present value of the future cash flows, which in this case is US$11b. The last step is to then divide the equity value by the number of shares outstanding. Compared to the current share price of US$42.1, the company appears quite good value at a 49% discount to where the stock price trades currently. Valuations are imprecise instruments though, rather like a telescope - move a few degrees and end up in a different galaxy. Do keep this in mind.
The Assumptions
We would point out that the most important inputs to a discounted cash flow are the discount rate and of course the actual cash flows. Part of investing is coming up with your own evaluation of a company's future performance, so try the calculation yourself and check your own assumptions. The DCF also does not consider the possible cyclicality of an industry, or a company's future capital requirements, so it does not give a full picture of a company's potential performance. Given that we are looking at Halozyme Therapeutics as potential shareholders, the cost of equity is used as the discount rate, rather than the cost of capital (or weighted average cost of capital, WACC) which accounts for debt. In this calculation we've used 6.3%, which is based on a levered beta of 0.822. Beta is a measure of a stock's volatility, compared to the market as a whole. We get our beta from the industry average beta of globally comparable companies, with an imposed limit between 0.8 and 2.0, which is a reasonable range for a stable business.
SWOT Analysis for Halozyme Therapeutics
- Earnings growth over the past year exceeded the industry.
- Debt is well covered by earnings and cashflows.
- Earnings growth over the past year is below its 5-year average.
- Annual earnings are forecast to grow faster than the American market.
- Good value based on P/E ratio and estimated fair value.
- Revenue is forecast to grow slower than 20% per year.
Looking Ahead:
Whilst important, the DCF calculation shouldn't be the only metric you look at when researching a company. The DCF model is not a perfect stock valuation tool. Rather it should be seen as a guide to "what assumptions need to be true for this stock to be under/overvalued?" For example, changes in the company's cost of equity or the risk free rate can significantly impact the valuation. Why is the intrinsic value higher than the current share price? For Halozyme Therapeutics, we've compiled three fundamental elements you should explore:
- Risks: For example, we've discovered 1 warning sign for Halozyme Therapeutics that you should be aware of before investing here.
- Future Earnings: How does HALO's growth rate compare to its peers and the wider market? Dig deeper into the analyst consensus number for the upcoming years by interacting with our free analyst growth expectation chart.
- Other High Quality Alternatives: Do you like a good all-rounder? Explore our interactive list of high quality stocks to get an idea of what else is out there you may be missing!
PS. The Simply Wall St app conducts a discounted cash flow valuation for every stock on the NASDAQGS every day. If you want to find the calculation for other stocks just search here.
Valuation is complex, but we're here to simplify it.
Discover if Halozyme Therapeutics might be undervalued or overvalued with our detailed analysis, featuring fair value estimates, potential risks, dividends, insider trades, and its financial condition.
Access Free AnalysisHave feedback on this article? Concerned about the content? Get in touch with us directly. Alternatively, email editorial-team (at) simplywallst.com.
This article by Simply Wall St is general in nature. We provide commentary based on historical data and analyst forecasts only using an unbiased methodology and our articles are not intended to be financial advice. It does not constitute a recommendation to buy or sell any stock, and does not take account of your objectives, or your financial situation. We aim to bring you long-term focused analysis driven by fundamental data. Note that our analysis may not factor in the latest price-sensitive company announcements or qualitative material. Simply Wall St has no position in any stocks mentioned.
About NasdaqGS:HALO
Halozyme Therapeutics
A biopharma technology platform company, researches, develops, and commercializes proprietary enzymes and devices in the United States, Switzerland, Belgium, Japan, and internationally.
Solid track record and good value.
Similar Companies
Market Insights

Community Narratives

