
Advertisement
- United States
- /
- Pharma
- /
- NasdaqGM:EYPT
More Unpleasant Surprises Could Be In Store For EyePoint Pharmaceuticals, Inc.'s (NASDAQ:EYPT) Shares After Tumbling 26%

EyePoint Pharmaceuticals, Inc. (NASDAQ:EYPT) shares have had a horrible month, losing 26% after a relatively good period beforehand. Nonetheless, the last 30 days have barely left a scratch on the stock's annual performance, which is up a whopping 603%.
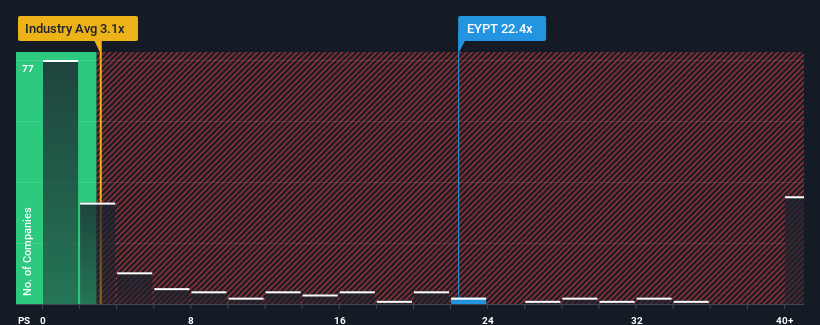
Even after such a large drop in price, EyePoint Pharmaceuticals may still be sending strong sell signals at present with a price-to-sales (or "P/S") ratio of 22.4x, when you consider almost half of the companies in the Pharmaceuticals industry in the United States have P/S ratios under 3.1x and even P/S lower than 0.7x aren't out of the ordinary. However, the P/S might be quite high for a reason and it requires further investigation to determine if it's justified.
View our latest analysis for EyePoint Pharmaceuticals
What Does EyePoint Pharmaceuticals' P/S Mean For Shareholders?
EyePoint Pharmaceuticals' revenue growth of late has been pretty similar to most other companies. One possibility is that the P/S ratio is high because investors think this modest revenue performance will accelerate. If not, then existing shareholders may be a little nervous about the viability of the share price.
Keen to find out how analysts think EyePoint Pharmaceuticals' future stacks up against the industry? In that case, our free report is a great place to start.What Are Revenue Growth Metrics Telling Us About The High P/S?
There's an inherent assumption that a company should far outperform the industry for P/S ratios like EyePoint Pharmaceuticals' to be considered reasonable.
Taking a look back first, we see that the company managed to grow revenues by a handy 11% last year. This was backed up an excellent period prior to see revenue up by 34% in total over the last three years. So we can start by confirming that the company has done a great job of growing revenues over that time.
Shifting to the future, estimates from the nine analysts covering the company suggest revenue growth is heading into negative territory, declining 34% per annum over the next three years. With the industry predicted to deliver 20% growth each year, that's a disappointing outcome.
With this information, we find it concerning that EyePoint Pharmaceuticals is trading at a P/S higher than the industry. It seems most investors are hoping for a turnaround in the company's business prospects, but the analyst cohort is not so confident this will happen. Only the boldest would assume these prices are sustainable as these declining revenues are likely to weigh heavily on the share price eventually.
The Bottom Line On EyePoint Pharmaceuticals' P/S
Even after such a strong price drop, EyePoint Pharmaceuticals' P/S still exceeds the industry median significantly. It's argued the price-to-sales ratio is an inferior measure of value within certain industries, but it can be a powerful business sentiment indicator.
We've established that EyePoint Pharmaceuticals currently trades on a much higher than expected P/S for a company whose revenues are forecast to decline. In cases like this where we see revenue decline on the horizon, we suspect the share price is at risk of following suit, bringing back the high P/S into the realms of suitability. At these price levels, investors should remain cautious, particularly if things don't improve.
You always need to take note of risks, for example - EyePoint Pharmaceuticals has 3 warning signs we think you should be aware of.
Of course, profitable companies with a history of great earnings growth are generally safer bets. So you may wish to see this free collection of other companies that have reasonable P/E ratios and have grown earnings strongly.
Valuation is complex, but we're here to simplify it.
Discover if EyePoint Pharmaceuticals might be undervalued or overvalued with our detailed analysis, featuring fair value estimates, potential risks, dividends, insider trades, and its financial condition.
Access Free AnalysisHave feedback on this article? Concerned about the content? Get in touch with us directly. Alternatively, email editorial-team (at) simplywallst.com.
This article by Simply Wall St is general in nature. We provide commentary based on historical data and analyst forecasts only using an unbiased methodology and our articles are not intended to be financial advice. It does not constitute a recommendation to buy or sell any stock, and does not take account of your objectives, or your financial situation. We aim to bring you long-term focused analysis driven by fundamental data. Note that our analysis may not factor in the latest price-sensitive company announcements or qualitative material. Simply Wall St has no position in any stocks mentioned.
About NasdaqGM:EYPT
EyePoint Pharmaceuticals
Engages in developing and commercializing therapeutics to improve the lives of patients with serious retinal diseases.
Flawless balance sheet and fair value.
Similar Companies
Market Insights


Advertisement
Community Narratives
Nike's Direct-to-Consumer Focus Will Drive Future Growth
Fair Value US$87.90|18.2% undervalued
UN
Community Contributor
Novo Nordisk will dominate GLP-1 market with Ozempic and Wegovy growth
Fair Value US$89.59|12.1% undervalued
BE
Community Contributor
Rheinmetall could get 20-25% of EU-NATO 3%-GDP defence spending
Fair Value €7.57k|82.8% undervalued
NO
Community Contributor