- United States
- /
- Pharma
- /
- NasdaqGM:EYPT
EyePoint Pharmaceuticals, Inc.'s (NASDAQ:EYPT) 29% Share Price Plunge Could Signal Some Risk

EyePoint Pharmaceuticals, Inc. (NASDAQ:EYPT) shares have had a horrible month, losing 29% after a relatively good period beforehand. The recent drop completes a disastrous twelve months for shareholders, who are sitting on a 61% loss during that time.
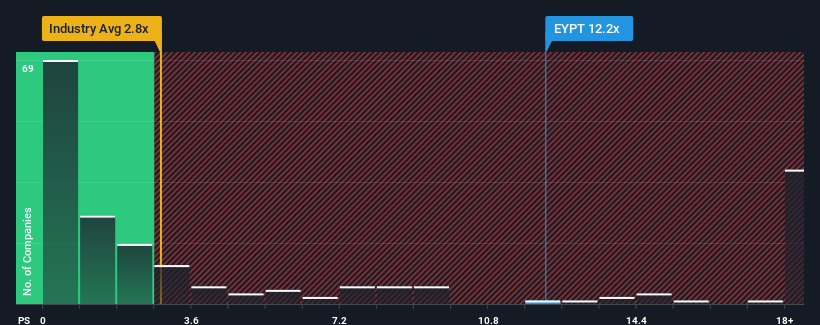
Although its price has dipped substantially, you could still be forgiven for thinking EyePoint Pharmaceuticals is a stock to steer clear of with a price-to-sales ratios (or "P/S") of 12.2x, considering almost half the companies in the United States' Pharmaceuticals industry have P/S ratios below 2.7x. Although, it's not wise to just take the P/S at face value as there may be an explanation why it's so lofty.
View our latest analysis for EyePoint Pharmaceuticals

What Does EyePoint Pharmaceuticals' Recent Performance Look Like?
EyePoint Pharmaceuticals could be doing better as it's been growing revenue less than most other companies lately. Perhaps the market is expecting future revenue performance to undergo a reversal of fortunes, which has elevated the P/S ratio. However, if this isn't the case, investors might get caught out paying too much for the stock.
Want the full picture on analyst estimates for the company? Then our free report on EyePoint Pharmaceuticals will help you uncover what's on the horizon.What Are Revenue Growth Metrics Telling Us About The High P/S?
The only time you'd be truly comfortable seeing a P/S as steep as EyePoint Pharmaceuticals' is when the company's growth is on track to outshine the industry decidedly.
If we review the last year of revenue growth, the company posted a worthy increase of 7.5%. Pleasingly, revenue has also lifted 41% in aggregate from three years ago, partly thanks to the last 12 months of growth. So we can start by confirming that the company has done a great job of growing revenues over that time.
Turning to the outlook, the next three years should bring diminished returns, with revenue decreasing 1.4% per annum as estimated by the eleven analysts watching the company. With the industry predicted to deliver 20% growth per annum, that's a disappointing outcome.
With this in mind, we find it intriguing that EyePoint Pharmaceuticals' P/S is closely matching its industry peers. It seems most investors are hoping for a turnaround in the company's business prospects, but the analyst cohort is not so confident this will happen. There's a very good chance these shareholders are setting themselves up for future disappointment if the P/S falls to levels more in line with the negative growth outlook.
The Key Takeaway
A significant share price dive has done very little to deflate EyePoint Pharmaceuticals' very lofty P/S. We'd say the price-to-sales ratio's power isn't primarily as a valuation instrument but rather to gauge current investor sentiment and future expectations.
For a company with revenues that are set to decline in the context of a growing industry, EyePoint Pharmaceuticals' P/S is much higher than we would've anticipated. Right now we aren't comfortable with the high P/S as the predicted future revenue decline likely to impact the positive sentiment that's propping up the P/S. This places shareholders' investments at significant risk and potential investors in danger of paying an excessive premium.
We don't want to rain on the parade too much, but we did also find 4 warning signs for EyePoint Pharmaceuticals (1 is significant!) that you need to be mindful of.
If strong companies turning a profit tickle your fancy, then you'll want to check out this free list of interesting companies that trade on a low P/E (but have proven they can grow earnings).
Valuation is complex, but we're here to simplify it.
Discover if EyePoint Pharmaceuticals might be undervalued or overvalued with our detailed analysis, featuring fair value estimates, potential risks, dividends, insider trades, and its financial condition.
Access Free AnalysisHave feedback on this article? Concerned about the content? Get in touch with us directly. Alternatively, email editorial-team (at) simplywallst.com.
This article by Simply Wall St is general in nature. We provide commentary based on historical data and analyst forecasts only using an unbiased methodology and our articles are not intended to be financial advice. It does not constitute a recommendation to buy or sell any stock, and does not take account of your objectives, or your financial situation. We aim to bring you long-term focused analysis driven by fundamental data. Note that our analysis may not factor in the latest price-sensitive company announcements or qualitative material. Simply Wall St has no position in any stocks mentioned.
About NasdaqGM:EYPT
EyePoint Pharmaceuticals
A clinical-stage biopharmaceutical company, engages in developing and commercializing therapeutics to improve the lives of patients with serious retinal diseases.
Flawless balance sheet low.

