Advertisement
- United States
- /
- Life Sciences
- /
- NasdaqGS:CDXS
Is Codexis (NASDAQ:CDXS) Weighed On By Its Debt Load?
Warren Buffett famously said, 'Volatility is far from synonymous with risk.' So it seems the smart money knows that debt - which is usually involved in bankruptcies - is a very important factor, when you assess how risky a company is. We note that Codexis, Inc. (NASDAQ:CDXS) does have debt on its balance sheet. But the more important question is: how much risk is that debt creating?
Why Does Debt Bring Risk?
Debt assists a business until the business has trouble paying it off, either with new capital or with free cash flow. Part and parcel of capitalism is the process of 'creative destruction' where failed businesses are mercilessly liquidated by their bankers. However, a more usual (but still expensive) situation is where a company must dilute shareholders at a cheap share price simply to get debt under control. Having said that, the most common situation is where a company manages its debt reasonably well - and to its own advantage. When we think about a company's use of debt, we first look at cash and debt together.
Check out our latest analysis for Codexis
What Is Codexis's Debt?
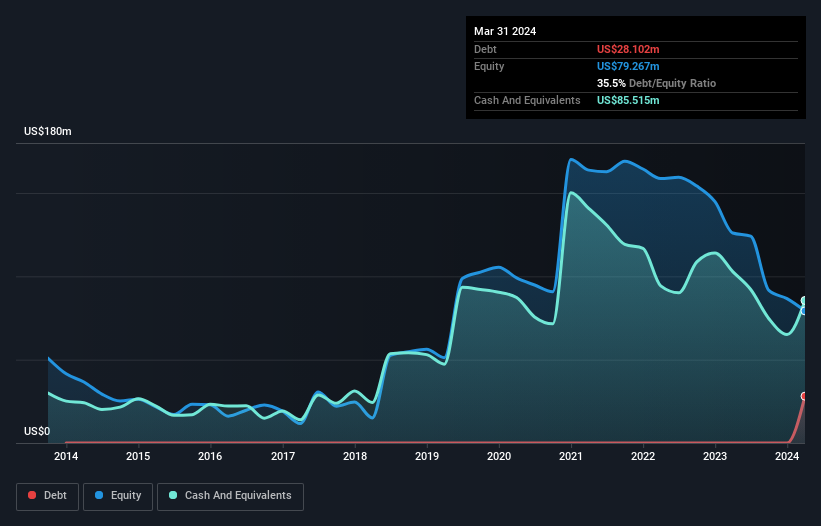
You can click the graphic below for the historical numbers, but it shows that as of March 2024 Codexis had US$28.1m of debt, an increase on none, over one year. But on the other hand it also has US$85.5m in cash, leading to a US$57.4m net cash position.
How Healthy Is Codexis' Balance Sheet?
The latest balance sheet data shows that Codexis had liabilities of US$29.1m due within a year, and liabilities of US$41.2m falling due after that. Offsetting this, it had US$85.5m in cash and US$14.2m in receivables that were due within 12 months. So it can boast US$29.4m more liquid assets than total liabilities.
This short term liquidity is a sign that Codexis could probably pay off its debt with ease, as its balance sheet is far from stretched. Succinctly put, Codexis boasts net cash, so it's fair to say it does not have a heavy debt load! There's no doubt that we learn most about debt from the balance sheet. But ultimately the future profitability of the business will decide if Codexis can strengthen its balance sheet over time. So if you want to see what the professionals think, you might find this free report on analyst profit forecasts to be interesting.
Over 12 months, Codexis made a loss at the EBIT level, and saw its revenue drop to US$74m, which is a fall of 36%. That makes us nervous, to say the least.
So How Risky Is Codexis?
We have no doubt that loss making companies are, in general, riskier than profitable ones. And the fact is that over the last twelve months Codexis lost money at the earnings before interest and tax (EBIT) line. And over the same period it saw negative free cash outflow of US$54m and booked a US$65m accounting loss. But at least it has US$57.4m on the balance sheet to spend on growth, near-term. Overall, its balance sheet doesn't seem overly risky, at the moment, but we're always cautious until we see the positive free cash flow. When analysing debt levels, the balance sheet is the obvious place to start. However, not all investment risk resides within the balance sheet - far from it. We've identified 3 warning signs with Codexis , and understanding them should be part of your investment process.
At the end of the day, it's often better to focus on companies that are free from net debt. You can access our special list of such companies (all with a track record of profit growth). It's free.
New: AI Stock Screener & Alerts
Our new AI Stock Screener scans the market every day to uncover opportunities.
• Dividend Powerhouses (3%+ Yield)
• Undervalued Small Caps with Insider Buying
• High growth Tech and AI Companies
Or build your own from over 50 metrics.
Have feedback on this article? Concerned about the content? Get in touch with us directly. Alternatively, email editorial-team (at) simplywallst.com.
This article by Simply Wall St is general in nature. We provide commentary based on historical data and analyst forecasts only using an unbiased methodology and our articles are not intended to be financial advice. It does not constitute a recommendation to buy or sell any stock, and does not take account of your objectives, or your financial situation. We aim to bring you long-term focused analysis driven by fundamental data. Note that our analysis may not factor in the latest price-sensitive company announcements or qualitative material. Simply Wall St has no position in any stocks mentioned.
Have feedback on this article? Concerned about the content? Get in touch with us directly. Alternatively, email editorial-team@simplywallst.com
About NasdaqGS:CDXS
Codexis
Provides technology solutions for therapeutics manufacturing, leveraging its proprietary CodeEvolver technology platform to discover, develop, enhance, and commercialize novel enzymes in the United States, Canada, Latin America, Europe, the Middle East, Africa, Australia, New Zealand, Southeast Asia, and China.
High growth potential with excellent balance sheet.
Similar Companies
Market Insights


Advertisement
Weekly Picks
LO


Lou_Basenese on Virtuix Holdings ·
From a “Shark Tank” Snub to an Air Force “Yes”: Why Virtuix at $3.50 May Be the Market’s Most Mispriced AI Story
Fair Value:US$7.563.6% undervalued
31 followersusers have followed this narrative
0 commentsusers have commented on this narrative
6 likesusers have liked this narrative
IN


Investingwilly on Mastercard ·
Mastercard: The Best Dividend Stock You're Ignoring
Fair Value:US$75032.0% undervalued
76 followersusers have followed this narrative
1 commentusers have commented on this narrative
9 likesusers have liked this narrative
TR


tripledub on Intuit ·
A Wonderful Business at a Not-So-Wonderful Price
Fair Value:US$56052.4% undervalued
66 followersusers have followed this narrative
4 commentsusers have commented on this narrative
31 likesusers have liked this narrative
TA


Talos on MindWalk Holdings ·
The Asymmetric TechBio Play: MindWalk Holdings and the Valuation Disconnect
Fair Value:US$8.2779.9% undervalued
36 followersusers have followed this narrative
0 commentsusers have commented on this narrative
9 likesusers have liked this narrative
Recently Updated Narratives
RO


RockeTeller on Abitibi Metals ·
Abitibi Metals’ High-Grade B26 Polymetallic Deposit Trading at a Fraction of Peers, 96% Undervalued?
Fair Value:CA$1.2950.4% undervalued
4 followersusers have followed this narrative
0 commentsusers have commented on this narrative
1 likeusers have liked this narrative
EV

everyseed on Zylox-Tonbridge Medical Technology ·
Zylox-Tonbridge: Early Signs of an Emerging Global Vascular Intervention Platform
Fair Value:HK$30.8539.9% undervalued
1 followerusers have followed this narrative
0 commentsusers have commented on this narrative
0 likesusers have liked this narrative
AN

Anthony_Lee on Geohan Corporation Berhad ·
Geohan's Growth Outlook Brightens on Expanding Order Book and Easing Cost Pressures
Fair Value:RM 0.7460.8% undervalued
2 followersusers have followed this narrative
0 commentsusers have commented on this narrative
0 likesusers have liked this narrative
Popular Narratives
IN
Investingwilly on Mastercard ·
Mastercard: The Best Dividend Stock You're Ignoring
Fair Value:US$75032.0% undervalued
76 followersusers have followed this narrative
1 commentusers have commented on this narrative
9 likesusers have liked this narrative
HA


HarishPK on Adobe ·
Adobe: A Probabilistic Case for Undervaluation
Fair Value:US$319.9635.5% undervalued
62 followersusers have followed this narrative
9 commentsusers have commented on this narrative
19 likesusers have liked this narrative
MA


martinarauz on Nu Holdings ·
Investment Analysis (May 2026)
Fair Value:US$22.7442.3% undervalued
68 followersusers have followed this narrative
0 commentsusers have commented on this narrative
17 likesusers have liked this narrative
