
Key Insights
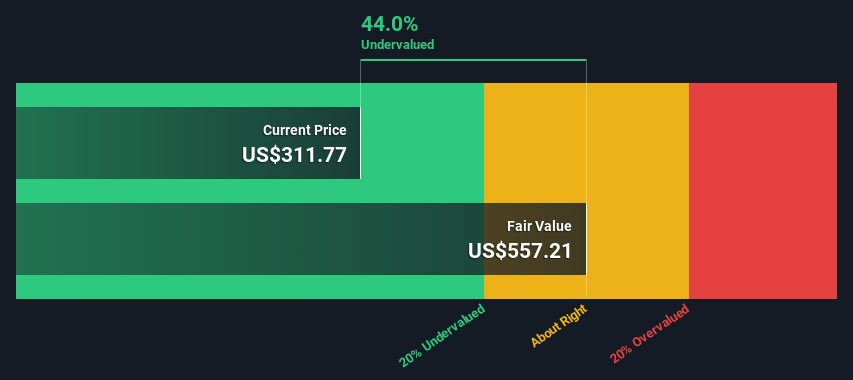
- Using the 2 Stage Free Cash Flow to Equity, Amgen fair value estimate is US$557
- Amgen is estimated to be 44% undervalued based on current share price of US$312
- Analyst price target for AMGN is US$290 which is 48% below our fair value estimate
Today we'll do a simple run through of a valuation method used to estimate the attractiveness of Amgen Inc. (NASDAQ:AMGN) as an investment opportunity by taking the expected future cash flows and discounting them to today's value. The Discounted Cash Flow (DCF) model is the tool we will apply to do this. Believe it or not, it's not too difficult to follow, as you'll see from our example!
Companies can be valued in a lot of ways, so we would point out that a DCF is not perfect for every situation. If you still have some burning questions about this type of valuation, take a look at the Simply Wall St analysis model.
See our latest analysis for Amgen
Step By Step Through The Calculation
We are going to use a two-stage DCF model, which, as the name states, takes into account two stages of growth. The first stage is generally a higher growth period which levels off heading towards the terminal value, captured in the second 'steady growth' period. In the first stage we need to estimate the cash flows to the business over the next ten years. Where possible we use analyst estimates, but when these aren't available we extrapolate the previous free cash flow (FCF) from the last estimate or reported value. We assume companies with shrinking free cash flow will slow their rate of shrinkage, and that companies with growing free cash flow will see their growth rate slow, over this period. We do this to reflect that growth tends to slow more in the early years than it does in later years.
A DCF is all about the idea that a dollar in the future is less valuable than a dollar today, and so the sum of these future cash flows is then discounted to today's value:
10-year free cash flow (FCF) estimate
| 2024 | 2025 | 2026 | 2027 | 2028 | 2029 | 2030 | 2031 | 2032 | 2033 | |
| Levered FCF ($, Millions) | US$11.3b | US$11.2b | US$11.4b | US$12.1b | US$13.6b | US$14.3b | US$14.9b | US$15.5b | US$16.0b | US$16.5b |
| Growth Rate Estimate Source | Analyst x5 | Analyst x5 | Analyst x3 | Analyst x3 | Analyst x2 | Est @ 5.28% | Est @ 4.36% | Est @ 3.72% | Est @ 3.27% | Est @ 2.95% |
| Present Value ($, Millions) Discounted @ 6.6% | US$10.6k | US$9.9k | US$9.4k | US$9.4k | US$9.9k | US$9.8k | US$9.5k | US$9.3k | US$9.0k | US$8.7k |
("Est" = FCF growth rate estimated by Simply Wall St)
Present Value of 10-year Cash Flow (PVCF) = US$95b
The second stage is also known as Terminal Value, this is the business's cash flow after the first stage. For a number of reasons a very conservative growth rate is used that cannot exceed that of a country's GDP growth. In this case we have used the 5-year average of the 10-year government bond yield (2.2%) to estimate future growth. In the same way as with the 10-year 'growth' period, we discount future cash flows to today's value, using a cost of equity of 6.6%.
Terminal Value (TV)= FCF2033 × (1 + g) ÷ (r – g) = US$16b× (1 + 2.2%) ÷ (6.6%– 2.2%) = US$384b
Present Value of Terminal Value (PVTV)= TV / (1 + r)10= US$384b÷ ( 1 + 6.6%)10= US$203b
The total value is the sum of cash flows for the next ten years plus the discounted terminal value, which results in the Total Equity Value, which in this case is US$298b. In the final step we divide the equity value by the number of shares outstanding. Compared to the current share price of US$312, the company appears quite good value at a 44% discount to where the stock price trades currently. Remember though, that this is just an approximate valuation, and like any complex formula - garbage in, garbage out.
Important Assumptions
We would point out that the most important inputs to a discounted cash flow are the discount rate and of course the actual cash flows. If you don't agree with these result, have a go at the calculation yourself and play with the assumptions. The DCF also does not consider the possible cyclicality of an industry, or a company's future capital requirements, so it does not give a full picture of a company's potential performance. Given that we are looking at Amgen as potential shareholders, the cost of equity is used as the discount rate, rather than the cost of capital (or weighted average cost of capital, WACC) which accounts for debt. In this calculation we've used 6.6%, which is based on a levered beta of 0.876. Beta is a measure of a stock's volatility, compared to the market as a whole. We get our beta from the industry average beta of globally comparable companies, with an imposed limit between 0.8 and 2.0, which is a reasonable range for a stable business.
SWOT Analysis for Amgen
- Earnings growth over the past year exceeded the industry.
- Debt is well covered by earnings.
- Dividends are covered by earnings and cash flows.
- Dividend is low compared to the top 25% of dividend payers in the Biotechs market.
- Annual earnings are forecast to grow for the next 4 years.
- Good value based on P/E ratio and estimated fair value.
- Debt is not well covered by operating cash flow.
- Annual earnings are forecast to grow slower than the American market.
Next Steps:
Although the valuation of a company is important, it is only one of many factors that you need to assess for a company. The DCF model is not a perfect stock valuation tool. Instead the best use for a DCF model is to test certain assumptions and theories to see if they would lead to the company being undervalued or overvalued. If a company grows at a different rate, or if its cost of equity or risk free rate changes sharply, the output can look very different. What is the reason for the share price sitting below the intrinsic value? For Amgen, we've compiled three relevant items you should further examine:
- Risks: Consider for instance, the ever-present spectre of investment risk. We've identified 2 warning signs with Amgen (at least 1 which is a bit concerning) , and understanding these should be part of your investment process.
- Management:Have insiders been ramping up their shares to take advantage of the market's sentiment for AMGN's future outlook? Check out our management and board analysis with insights on CEO compensation and governance factors.
- Other High Quality Alternatives: Do you like a good all-rounder? Explore our interactive list of high quality stocks to get an idea of what else is out there you may be missing!
PS. The Simply Wall St app conducts a discounted cash flow valuation for every stock on the NASDAQGS every day. If you want to find the calculation for other stocks just search here.
New: Manage All Your Stock Portfolios in One Place
We've created the ultimate portfolio companion for stock investors, and it's free.
• Connect an unlimited number of Portfolios and see your total in one currency
• Be alerted to new Warning Signs or Risks via email or mobile
• Track the Fair Value of your stocks
Have feedback on this article? Concerned about the content? Get in touch with us directly. Alternatively, email editorial-team (at) simplywallst.com.
This article by Simply Wall St is general in nature. We provide commentary based on historical data and analyst forecasts only using an unbiased methodology and our articles are not intended to be financial advice. It does not constitute a recommendation to buy or sell any stock, and does not take account of your objectives, or your financial situation. We aim to bring you long-term focused analysis driven by fundamental data. Note that our analysis may not factor in the latest price-sensitive company announcements or qualitative material. Simply Wall St has no position in any stocks mentioned.
About NasdaqGS:AMGN
Amgen
Amgen Inc. discovers, develops, manufactures, and delivers human therapeutics worldwide.
Average dividend payer slight.
