
Advertisement
- United States
- /
- Media
- /
- NasdaqGM:TTGT
Further weakness as TechTarget (NASDAQ:TTGT) drops 7.3% this week, taking three-year losses to 71%

It's not possible to invest over long periods without making some bad investments. But really big losses can really drag down an overall portfolio. So take a moment to sympathize with the long term shareholders of TechTarget, Inc. (NASDAQ:TTGT), who have seen the share price tank a massive 71% over a three year period. That would certainly shake our confidence in the decision to own the stock. And over the last year the share price fell 22%, so we doubt many shareholders are delighted. Shareholders have had an even rougher run lately, with the share price down 24% in the last 90 days.
Since TechTarget has shed US$53m from its value in the past 7 days, let's see if the longer term decline has been driven by the business' economics.
See our latest analysis for TechTarget
While the efficient markets hypothesis continues to be taught by some, it has been proven that markets are over-reactive dynamic systems, and investors are not always rational. One flawed but reasonable way to assess how sentiment around a company has changed is to compare the earnings per share (EPS) with the share price.
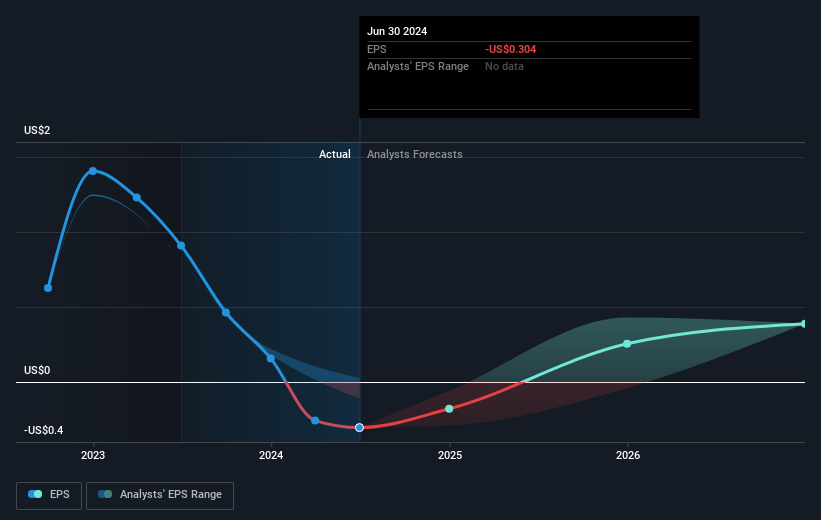
Over the three years that the share price declined, TechTarget's earnings per share (EPS) dropped significantly, falling to a loss. Due to the loss, it's not easy to use EPS as a reliable guide to the business. However, we can say we'd expect to see a falling share price in this scenario.
You can see how EPS has changed over time in the image below (click on the chart to see the exact values).
Before buying or selling a stock, we always recommend a close examination of historic growth trends, available here.
A Different Perspective
TechTarget shareholders are down 22% for the year, but the market itself is up 34%. However, keep in mind that even the best stocks will sometimes underperform the market over a twelve month period. On the bright side, long term shareholders have made money, with a gain of 0.9% per year over half a decade. It could be that the recent sell-off is an opportunity, so it may be worth checking the fundamental data for signs of a long term growth trend. It's always interesting to track share price performance over the longer term. But to understand TechTarget better, we need to consider many other factors. Even so, be aware that TechTarget is showing 2 warning signs in our investment analysis , you should know about...
For those who like to find winning investments this free list of undervalued companies with recent insider purchasing, could be just the ticket.
Please note, the market returns quoted in this article reflect the market weighted average returns of stocks that currently trade on American exchanges.
Valuation is complex, but we're here to simplify it.
Discover if TechTarget might be undervalued or overvalued with our detailed analysis, featuring fair value estimates, potential risks, dividends, insider trades, and its financial condition.
Access Free AnalysisHave feedback on this article? Concerned about the content? Get in touch with us directly. Alternatively, email editorial-team (at) simplywallst.com.
This article by Simply Wall St is general in nature. We provide commentary based on historical data and analyst forecasts only using an unbiased methodology and our articles are not intended to be financial advice. It does not constitute a recommendation to buy or sell any stock, and does not take account of your objectives, or your financial situation. We aim to bring you long-term focused analysis driven by fundamental data. Note that our analysis may not factor in the latest price-sensitive company announcements or qualitative material. Simply Wall St has no position in any stocks mentioned.
About NasdaqGM:TTGT
TechTarget
Provides marketing and sales services that deliver business impact for business-to-business technology companies in North America and internationally.
Moderate growth potential and slightly overvalued.
Similar Companies
Market Insights


Advertisement
Community Narratives
The Future of Drug Testing? Fingerprint Tech Shows Serious Promise
Fair Value US$2.98|40.3% undervalued
JO
Community Contributor
Suncorp’s Next Chapter: Insurance-Only and Ready to Grow
Fair Value AU$22.83|7.9% undervalued
RO
Community Contributor
Thyssenkrupp Nucera Will Achieve Double-Digit Profits by 2030 Boosted by Hydrogen Growth
Fair Value €14.40|31.6% undervalued
CH
Community Contributor
Tesla’s Nvidia Moment – The AI & Robotics Inflection Point
Fair Value US$359.72|12.3% undervalued
BL
Community Contributor