- United States
- /
- Entertainment
- /
- NasdaqGS:ROKU
Is There An Opportunity With Roku, Inc.'s (NASDAQ:ROKU) 45% Undervaluation?


Key Insights
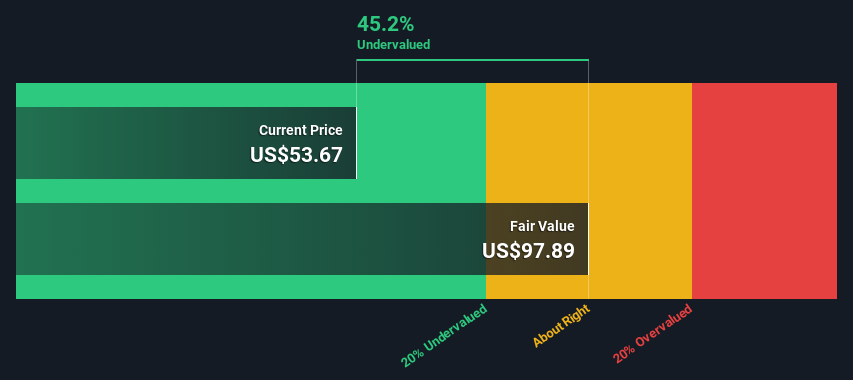
- Roku's estimated fair value is US$97.89 based on 2 Stage Free Cash Flow to Equity
- Roku is estimated to be 45% undervalued based on current share price of US$53.67
- Our fair value estimate is 34% higher than Roku's analyst price target of US$73.18
Today we'll do a simple run through of a valuation method used to estimate the attractiveness of Roku, Inc. (NASDAQ:ROKU) as an investment opportunity by projecting its future cash flows and then discounting them to today's value. The Discounted Cash Flow (DCF) model is the tool we will apply to do this. Models like these may appear beyond the comprehension of a lay person, but they're fairly easy to follow.
Remember though, that there are many ways to estimate a company's value, and a DCF is just one method. For those who are keen learners of equity analysis, the Simply Wall St analysis model here may be something of interest to you.
View our latest analysis for Roku
The Calculation
We're using the 2-stage growth model, which simply means we take in account two stages of company's growth. In the initial period the company may have a higher growth rate and the second stage is usually assumed to have a stable growth rate. To start off with, we need to estimate the next ten years of cash flows. Where possible we use analyst estimates, but when these aren't available we extrapolate the previous free cash flow (FCF) from the last estimate or reported value. We assume companies with shrinking free cash flow will slow their rate of shrinkage, and that companies with growing free cash flow will see their growth rate slow, over this period. We do this to reflect that growth tends to slow more in the early years than it does in later years.
Generally we assume that a dollar today is more valuable than a dollar in the future, so we discount the value of these future cash flows to their estimated value in today's dollars:
10-year free cash flow (FCF) estimate
| 2024 | 2025 | 2026 | 2027 | 2028 | 2029 | 2030 | 2031 | 2032 | 2033 | |
| Levered FCF ($, Millions) | US$150.2m | US$275.6m | US$464.3m | US$723.4m | US$793.9m | US$846.9m | US$892.6m | US$932.7m | US$968.6m | US$1.00b |
| Growth Rate Estimate Source | Analyst x10 | Analyst x10 | Analyst x6 | Analyst x2 | Analyst x2 | Est @ 6.68% | Est @ 5.39% | Est @ 4.49% | Est @ 3.86% | Est @ 3.41% |
| Present Value ($, Millions) Discounted @ 7.5% | US$140 | US$238 | US$374 | US$541 | US$553 | US$548 | US$537 | US$522 | US$504 | US$485 |
("Est" = FCF growth rate estimated by Simply Wall St)
Present Value of 10-year Cash Flow (PVCF) = US$4.4b
The second stage is also known as Terminal Value, this is the business's cash flow after the first stage. The Gordon Growth formula is used to calculate Terminal Value at a future annual growth rate equal to the 5-year average of the 10-year government bond yield of 2.4%. We discount the terminal cash flows to today's value at a cost of equity of 7.5%.
Terminal Value (TV)= FCF2033 × (1 + g) ÷ (r – g) = US$1.0b× (1 + 2.4%) ÷ (7.5%– 2.4%) = US$20b
Present Value of Terminal Value (PVTV)= TV / (1 + r)10= US$20b÷ ( 1 + 7.5%)10= US$9.7b
The total value, or equity value, is then the sum of the present value of the future cash flows, which in this case is US$14b. To get the intrinsic value per share, we divide this by the total number of shares outstanding. Relative to the current share price of US$53.7, the company appears quite undervalued at a 45% discount to where the stock price trades currently. Valuations are imprecise instruments though, rather like a telescope - move a few degrees and end up in a different galaxy. Do keep this in mind.
The Assumptions
The calculation above is very dependent on two assumptions. The first is the discount rate and the other is the cash flows. You don't have to agree with these inputs, I recommend redoing the calculations yourself and playing with them. The DCF also does not consider the possible cyclicality of an industry, or a company's future capital requirements, so it does not give a full picture of a company's potential performance. Given that we are looking at Roku as potential shareholders, the cost of equity is used as the discount rate, rather than the cost of capital (or weighted average cost of capital, WACC) which accounts for debt. In this calculation we've used 7.5%, which is based on a levered beta of 1.117. Beta is a measure of a stock's volatility, compared to the market as a whole. We get our beta from the industry average beta of globally comparable companies, with an imposed limit between 0.8 and 2.0, which is a reasonable range for a stable business.
SWOT Analysis for Roku
- Currently debt free.
- Shareholders have been diluted in the past year.
- Forecast to reduce losses next year.
- Has sufficient cash runway for more than 3 years based on current free cash flows.
- Trading below our estimate of fair value by more than 20%.
- Not expected to become profitable over the next 3 years.
Looking Ahead:
Although the valuation of a company is important, it is only one of many factors that you need to assess for a company. It's not possible to obtain a foolproof valuation with a DCF model. Rather it should be seen as a guide to "what assumptions need to be true for this stock to be under/overvalued?" If a company grows at a different rate, or if its cost of equity or risk free rate changes sharply, the output can look very different. What is the reason for the share price sitting below the intrinsic value? For Roku, there are three important aspects you should further research:
- Risks: Be aware that Roku is showing 2 warning signs in our investment analysis , you should know about...
- Future Earnings: How does ROKU's growth rate compare to its peers and the wider market? Dig deeper into the analyst consensus number for the upcoming years by interacting with our free analyst growth expectation chart.
- Other Solid Businesses: Low debt, high returns on equity and good past performance are fundamental to a strong business. Why not explore our interactive list of stocks with solid business fundamentals to see if there are other companies you may not have considered!
PS. Simply Wall St updates its DCF calculation for every American stock every day, so if you want to find the intrinsic value of any other stock just search here.
If you're looking to trade Roku, open an account with the lowest-cost platform trusted by professionals, Interactive Brokers.
With clients in over 200 countries and territories, and access to 160 markets, IBKR lets you trade stocks, options, futures, forex, bonds and funds from a single integrated account.
Enjoy no hidden fees, no account minimums, and FX conversion rates as low as 0.03%, far better than what most brokers offer.
Sponsored ContentNew: AI Stock Screener & Alerts
Our new AI Stock Screener scans the market every day to uncover opportunities.
• Dividend Powerhouses (3%+ Yield)
• Undervalued Small Caps with Insider Buying
• High growth Tech and AI Companies
Or build your own from over 50 metrics.
Have feedback on this article? Concerned about the content? Get in touch with us directly. Alternatively, email editorial-team (at) simplywallst.com.
This article by Simply Wall St is general in nature. We provide commentary based on historical data and analyst forecasts only using an unbiased methodology and our articles are not intended to be financial advice. It does not constitute a recommendation to buy or sell any stock, and does not take account of your objectives, or your financial situation. We aim to bring you long-term focused analysis driven by fundamental data. Note that our analysis may not factor in the latest price-sensitive company announcements or qualitative material. Simply Wall St has no position in any stocks mentioned.
Have feedback on this article? Concerned about the content? Get in touch with us directly. Alternatively, email editorial-team@simplywallst.com
About NasdaqGS:ROKU
Roku
Operates a TV streaming platform in the United states and internationally.
Flawless balance sheet and good value.
Similar Companies
Market Insights

Community Narratives

