
Advertisement
- United States
- /
- Interactive Media and Services
- /
- NasdaqGS:QNST
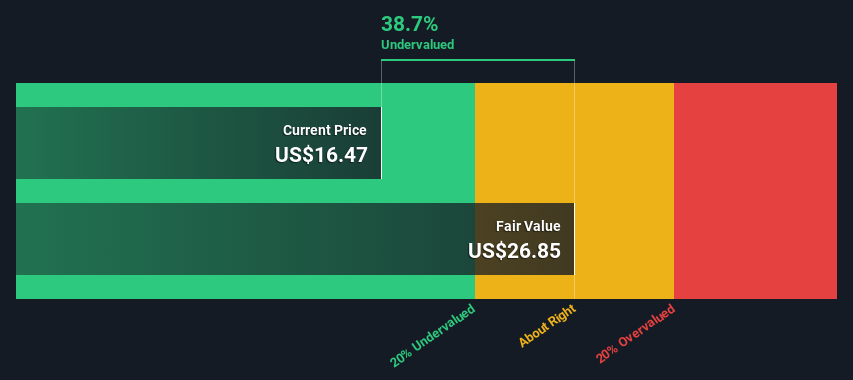
An Intrinsic Calculation For QuinStreet, Inc. (NASDAQ:QNST) Suggests It's 39% Undervalued
Key Insights
- Using the 2 Stage Free Cash Flow to Equity, QuinStreet fair value estimate is US$26.85
- Current share price of US$16.47 suggests QuinStreet is potentially 39% undervalued
- The US$15.80 analyst price target for QNST is 41% less than our estimate of fair value
Today we will run through one way of estimating the intrinsic value of QuinStreet, Inc. (NASDAQ:QNST) by taking the expected future cash flows and discounting them to today's value. The Discounted Cash Flow (DCF) model is the tool we will apply to do this. Models like these may appear beyond the comprehension of a lay person, but they're fairly easy to follow.
Companies can be valued in a lot of ways, so we would point out that a DCF is not perfect for every situation. Anyone interested in learning a bit more about intrinsic value should have a read of the Simply Wall St analysis model.
See our latest analysis for QuinStreet
Step By Step Through The Calculation
We're using the 2-stage growth model, which simply means we take in account two stages of company's growth. In the initial period the company may have a higher growth rate and the second stage is usually assumed to have a stable growth rate. To begin with, we have to get estimates of the next ten years of cash flows. Where possible we use analyst estimates, but when these aren't available we extrapolate the previous free cash flow (FCF) from the last estimate or reported value. We assume companies with shrinking free cash flow will slow their rate of shrinkage, and that companies with growing free cash flow will see their growth rate slow, over this period. We do this to reflect that growth tends to slow more in the early years than it does in later years.
A DCF is all about the idea that a dollar in the future is less valuable than a dollar today, and so the sum of these future cash flows is then discounted to today's value:
10-year free cash flow (FCF) forecast
| 2024 | 2025 | 2026 | 2027 | 2028 | 2029 | 2030 | 2031 | 2032 | 2033 | |
| Levered FCF ($, Millions) | -US$14.0m | US$23.9m | US$35.9m | US$48.8m | US$61.4m | US$72.9m | US$83.0m | US$91.6m | US$98.8m | US$105.0m |
| Growth Rate Estimate Source | Analyst x1 | Analyst x1 | Est @ 50.21% | Est @ 35.83% | Est @ 25.77% | Est @ 18.73% | Est @ 13.80% | Est @ 10.34% | Est @ 7.93% | Est @ 6.24% |
| Present Value ($, Millions) Discounted @ 7.2% | -US$13.0 | US$20.8 | US$29.2 | US$37.0 | US$43.4 | US$48.1 | US$51.1 | US$52.6 | US$53.0 | US$52.5 |
("Est" = FCF growth rate estimated by Simply Wall St)
Present Value of 10-year Cash Flow (PVCF) = US$375m
The second stage is also known as Terminal Value, this is the business's cash flow after the first stage. For a number of reasons a very conservative growth rate is used that cannot exceed that of a country's GDP growth. In this case we have used the 5-year average of the 10-year government bond yield (2.3%) to estimate future growth. In the same way as with the 10-year 'growth' period, we discount future cash flows to today's value, using a cost of equity of 7.2%.
Terminal Value (TV)= FCF2033 × (1 + g) ÷ (r – g) = US$105m× (1 + 2.3%) ÷ (7.2%– 2.3%) = US$2.2b
Present Value of Terminal Value (PVTV)= TV / (1 + r)10= US$2.2b÷ ( 1 + 7.2%)10= US$1.1b
The total value, or equity value, is then the sum of the present value of the future cash flows, which in this case is US$1.5b. In the final step we divide the equity value by the number of shares outstanding. Compared to the current share price of US$16.5, the company appears quite good value at a 39% discount to where the stock price trades currently. Valuations are imprecise instruments though, rather like a telescope - move a few degrees and end up in a different galaxy. Do keep this in mind.
The Assumptions
We would point out that the most important inputs to a discounted cash flow are the discount rate and of course the actual cash flows. You don't have to agree with these inputs, I recommend redoing the calculations yourself and playing with them. The DCF also does not consider the possible cyclicality of an industry, or a company's future capital requirements, so it does not give a full picture of a company's potential performance. Given that we are looking at QuinStreet as potential shareholders, the cost of equity is used as the discount rate, rather than the cost of capital (or weighted average cost of capital, WACC) which accounts for debt. In this calculation we've used 7.2%, which is based on a levered beta of 1.062. Beta is a measure of a stock's volatility, compared to the market as a whole. We get our beta from the industry average beta of globally comparable companies, with an imposed limit between 0.8 and 2.0, which is a reasonable range for a stable business.
SWOT Analysis for QuinStreet
Strength
- Currently debt free.
Weakness
- Shareholders have been diluted in the past year.
Opportunity
- Forecast to reduce losses next year.
- Trading below our estimate of fair value by more than 20%.
Threat
- Has less than 3 years of cash runway based on current free cash flow.
Moving On:
Although the valuation of a company is important, it ideally won't be the sole piece of analysis you scrutinize for a company. The DCF model is not a perfect stock valuation tool. Rather it should be seen as a guide to "what assumptions need to be true for this stock to be under/overvalued?" For instance, if the terminal value growth rate is adjusted slightly, it can dramatically alter the overall result. What is the reason for the share price sitting below the intrinsic value? For QuinStreet, we've compiled three additional items you should look at:
- Risks: Be aware that QuinStreet is showing 2 warning signs in our investment analysis , you should know about...
- Future Earnings: How does QNST's growth rate compare to its peers and the wider market? Dig deeper into the analyst consensus number for the upcoming years by interacting with our free analyst growth expectation chart.
- Other Solid Businesses: Low debt, high returns on equity and good past performance are fundamental to a strong business. Why not explore our interactive list of stocks with solid business fundamentals to see if there are other companies you may not have considered!
PS. Simply Wall St updates its DCF calculation for every American stock every day, so if you want to find the intrinsic value of any other stock just search here.
Valuation is complex, but we're here to simplify it.
Discover if QuinStreet might be undervalued or overvalued with our detailed analysis, featuring fair value estimates, potential risks, dividends, insider trades, and its financial condition.
Access Free AnalysisHave feedback on this article? Concerned about the content? Get in touch with us directly. Alternatively, email editorial-team (at) simplywallst.com.
This article by Simply Wall St is general in nature. We provide commentary based on historical data and analyst forecasts only using an unbiased methodology and our articles are not intended to be financial advice. It does not constitute a recommendation to buy or sell any stock, and does not take account of your objectives, or your financial situation. We aim to bring you long-term focused analysis driven by fundamental data. Note that our analysis may not factor in the latest price-sensitive company announcements or qualitative material. Simply Wall St has no position in any stocks mentioned.
About NasdaqGS:QNST
QuinStreet
An online performance marketing company, provides customer acquisition services for its clients in the United States and internationally.
Flawless balance sheet and fair value.
Similar Companies
Market Insights

Advertisement
Community Narratives
Kodiak AI - a potential 100 bagger opportunity?
Fair Value US$14.00|44.7% undervalued
DA
Community Contributor
A Fair Price for a Great Business Facing Real Threats
Fair Value US$383.06|10.4% undervalued
IM
Community Contributor
AXON And Shopify Integration Will Unlock Global Mobile Advertising
Fair Value US$646.30|12.4% undervalued
AN
Based on Analyst Price Targets