Advertisement
- United States
- /
- Media
- /
- NasdaqGS:NXST
How the Jimmy Kimmel Controversy Impacts Nexstar Stock Value in 2025

Simply Wall St
Reviewed by Bailey Pemberton
So, you’re wondering whether Nexstar Media Group’s stock is a buy, a hold, or time to move on? There’s no denying this stock has turned heads lately, both for its strong multi-year returns and the swirl of headlines tied to its high-profile TV business. Despite a rocky September, with the ongoing “Jimmy Kimmel Live!” controversy prompting Nexstar to preempt the show, which drew headlines and fresh attention from media insiders and investors alike, the company’s shares have proved resilient. In the past week alone, Nexstar bounced up 3.6%. The 1-year return sits at 27.8%, and if you’ve held for five years, you’re up a stunning 168.9%.
Still, the price hasn’t gone up in a straight line. Over the last month, shares have dipped 2.8% as Wall Street digests the risks and potential long-term impact of removing major late-night programming. Yet, the stock has climbed an impressive 27.5% year-to-date, suggesting the market isn’t overly concerned about these short-term programming shifts, at least not yet.
When we consider how investors typically value media companies, using things like earnings multiples, cash flow ratios, and asset valuations, Nexstar scores a 5 out of 6 on the classic undervaluation checks. That would put it high on any value investor’s watchlist. But which methods matter most right now, and how reliable are these scores? Let’s break down the main ways to value Nexstar today, and after that, I’ll share the one angle savvy investors shouldn’t overlook.
Approach 1: Nexstar Media Group Discounted Cash Flow (DCF) Analysis
The Discounted Cash Flow (DCF) approach estimates what a business is worth today based on its expected future cash flows. It projects those numbers out over several years and then discounts them back to present value. This model attempts to account for both the time value of money and future business potential.
For Nexstar Media Group, recent reports show trailing twelve-month free cash flow at $1.2 Billion. Looking ahead, independent analysts see free cash flow moving between $900 Million and $1.1 Billion annually through 2028. Beyond that window, longer-term projections by Simply Wall St anticipate steady growth, with 2035 free cash flow forecasted at approximately $1.4 Billion.
The result of this analysis is that the DCF calculates an intrinsic value of $649 per share. This figure is 68.7% above the current share price, indicating Nexstar is deeply undervalued by this metric.
Result: UNDERVALUED
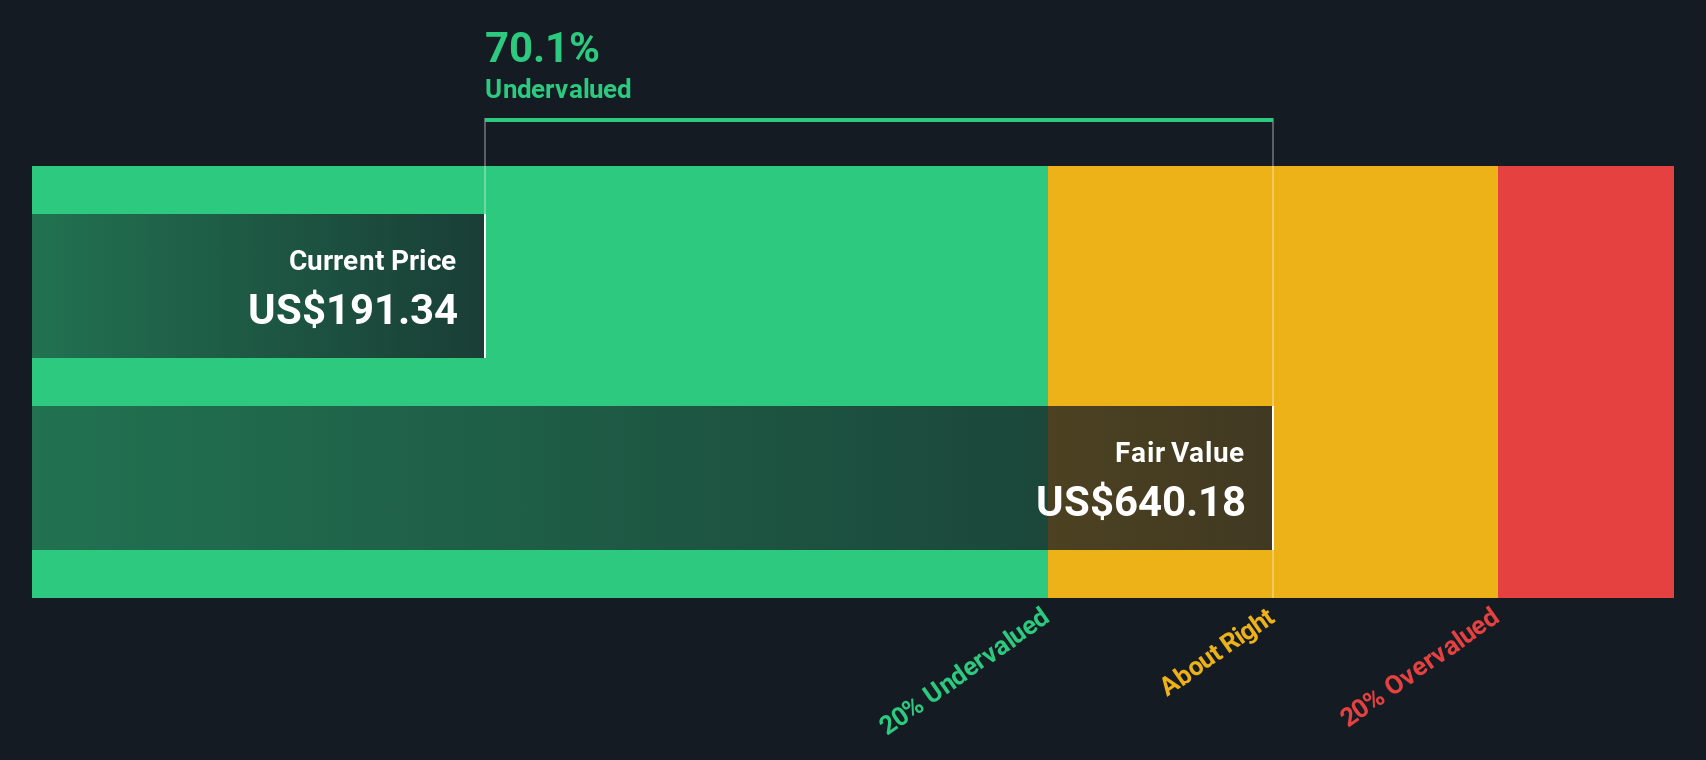
Our Discounted Cash Flow (DCF) analysis suggests Nexstar Media Group is undervalued by 68.7%. Track this in your watchlist or portfolio, or discover more undervalued stocks.
Approach 2: Nexstar Media Group Price vs Earnings
The Price-to-Earnings (PE) ratio is a classic tool for valuing profitable companies because it directly relates the company’s market price to its current earnings per share. For companies like Nexstar that deliver consistent profits, the PE gives investors a quick way to gauge how much the market is willing to pay for each dollar of earnings.
It’s important to remember that what counts as a “normal” or “fair” PE ratio can vary a lot depending on future growth expectations and risk. High-growth, low-risk companies tend to command above-average PEs, while riskier or slower-growing firms usually trade at lower multiples.
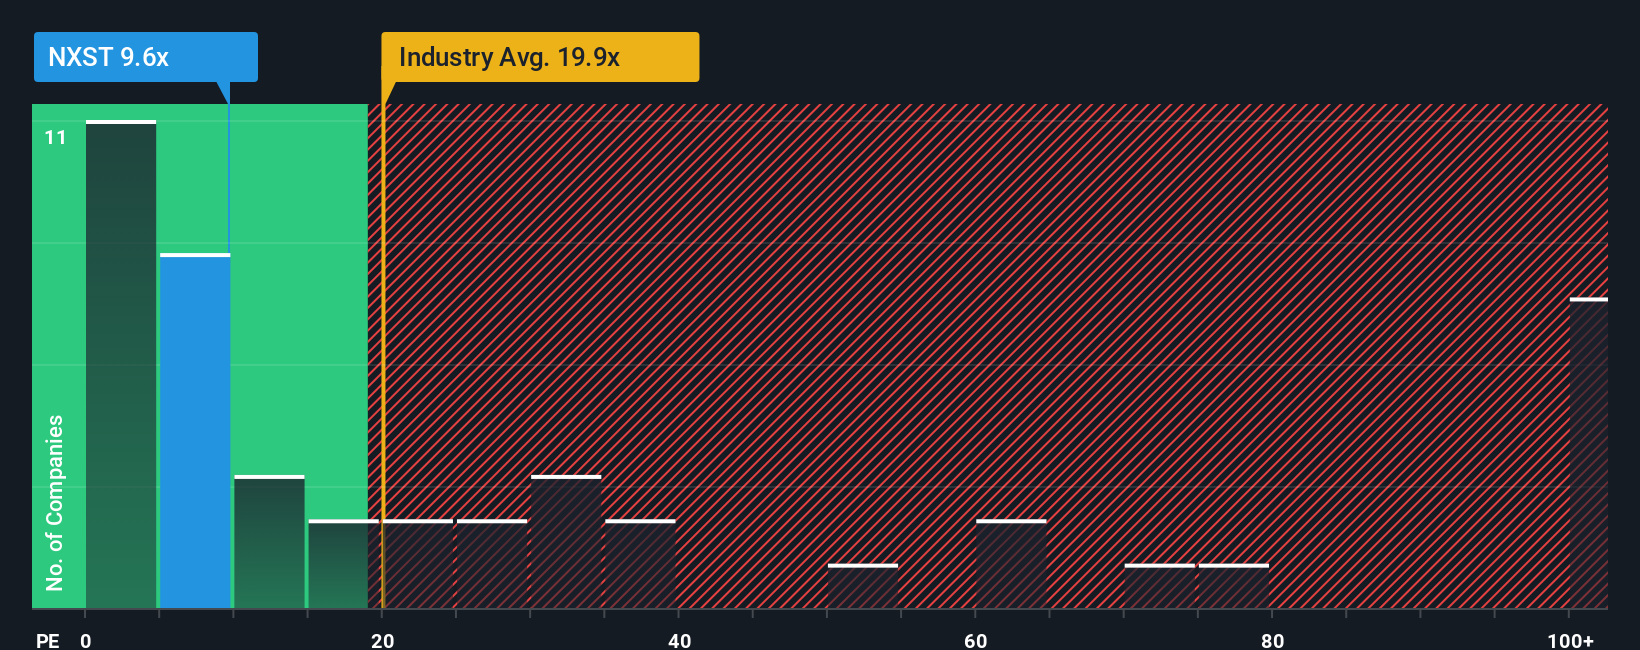
Currently, Nexstar Media Group is trading at a PE ratio of 10.16x. For comparison, the media industry’s average PE is 19.80x, and its closest peers average 10.45x. On the surface, Nexstar looks relatively cheap compared to the broader industry and slightly below its peer group.
Simply Wall St’s proprietary “Fair Ratio” for Nexstar is 18.79x. This calculation includes more factors than just industry or peer comparisons, accounting for Nexstar’s unique combination of earnings growth, risk profile, profit margins, market cap, and sector dynamics. The Fair Ratio is designed to be a more tailored assessment of what the multiple should be.
With the actual PE (10.16x) still well below its Fair Ratio (18.79x), Nexstar stock appears undervalued by this metric.
Result: UNDERVALUED
PE ratios tell one story, but what if the real opportunity lies elsewhere? Discover companies where insiders are betting big on explosive growth.
Upgrade Your Decision Making: Choose your Nexstar Media Group Narrative
Earlier we mentioned that there’s an even better way to understand valuation, so let’s introduce you to Narratives. A Narrative is your story behind the numbers: a simple, intuitive way to tie together your assumptions about Nexstar’s future (like revenue, earnings, and margins) and see how those shape your fair value for the stock.
Instead of just crunching ratios, Narratives help you connect what’s happening in the business or industry to a financial forecast and ultimately a valuation, all with a clear line from story to numbers. On Simply Wall St’s Community page (trusted by millions of investors), you can easily create or explore Narratives, adjusting forecasts and seeing in real time how new developments, such as news or earnings, impact the investment outlook.
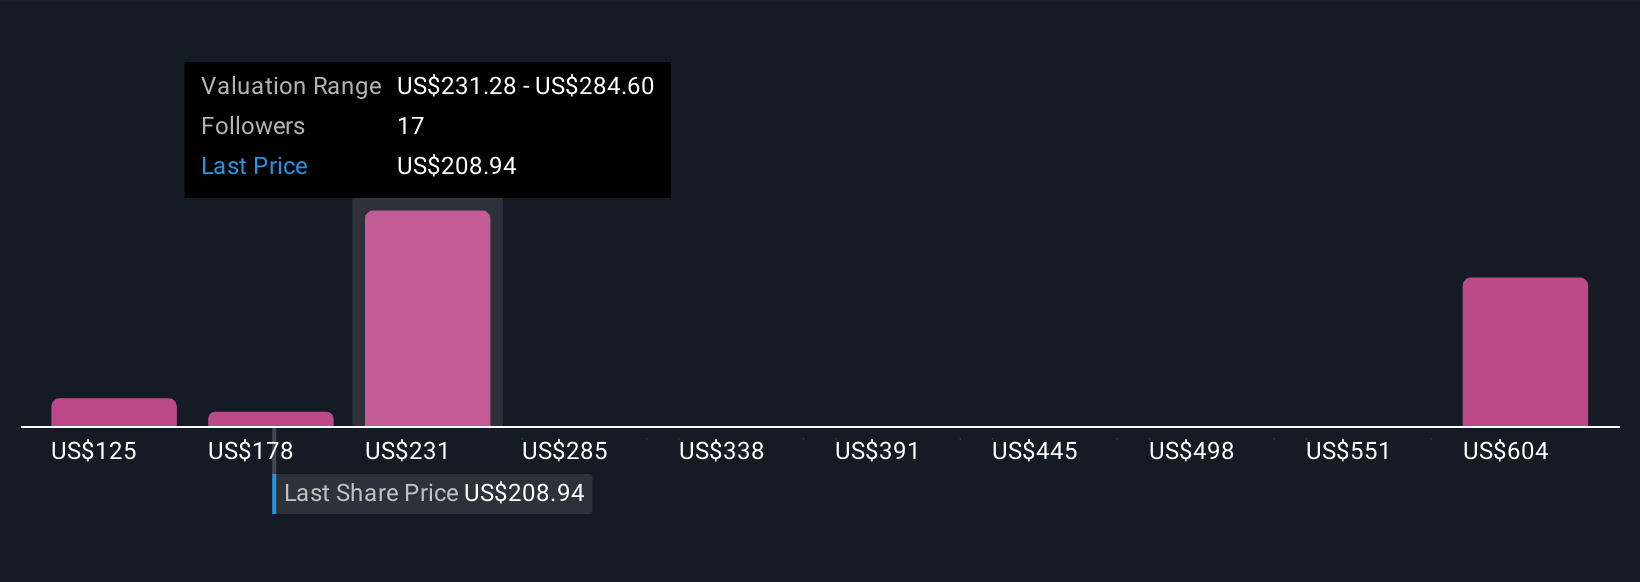
This means you can instantly compare Fair Value from any Narrative to the latest share price and decide when it makes sense to buy or sell, bringing clarity and confidence to every decision. For example, one bullish Narrative for Nexstar sets a price target of $250, based on expanding market share and digital growth, while a more cautious view values the stock closer to $190, highlighting regulatory uncertainty and declining TV audiences. This demonstrates how different assumptions can lead to very different actions.
Do you think there's more to the story for Nexstar Media Group? Create your own Narrative to let the Community know!
This article by Simply Wall St is general in nature. We provide commentary based on historical data and analyst forecasts only using an unbiased methodology and our articles are not intended to be financial advice. It does not constitute a recommendation to buy or sell any stock, and does not take account of your objectives, or your financial situation. We aim to bring you long-term focused analysis driven by fundamental data. Note that our analysis may not factor in the latest price-sensitive company announcements or qualitative material. Simply Wall St has no position in any stocks mentioned.
Valuation is complex, but we're here to simplify it.
Discover if Nexstar Media Group might be undervalued or overvalued with our detailed analysis, featuring fair value estimates, potential risks, dividends, insider trades, and its financial condition.
Access Free AnalysisHave feedback on this article? Concerned about the content? Get in touch with us directly. Alternatively, email editorial-team@simplywallst.com
About NasdaqGS:NXST
Nexstar Media Group
Operates as a diversified media company that produces and distributes local and national news, sports, and entertainment contents on the television and digital platforms in the United States.
Undervalued established dividend payer.
Similar Companies
Market Insights

Advertisement
Community Narratives
A formidable player in AI and enterprise computing.
Fair Value US$210.00|12.2% overvalued
CO
Community Contributor
IREN's Bold Moves in Sustainable Bitcoin Mining & AI Data Centers
Fair Value US$72.52|17.1% undervalued
BL
Community Contributor
Cooling the Champions: The Aussie Tech Behind F1's Victories
Fair Value AU$12.40|38.1% undervalued
TR
Community Contributor