
Advertisement
- United States
- /
- Interactive Media and Services
- /
- NasdaqGS:GOOGL
Alphabet Inc. (NASDAQ:GOOGL) Stock Has Shown Weakness Lately But Financials Look Strong: Should Prospective Shareholders Make The Leap?
Alphabet (NASDAQ:GOOGL) has had a rough three months with its share price down 12%. But if you pay close attention, you might gather that its strong financials could mean that the stock could potentially see an increase in value in the long-term, given how markets usually reward companies with good financial health. Specifically, we decided to study Alphabet's ROE in this article.
Return on Equity or ROE is a test of how effectively a company is growing its value and managing investors’ money. Put another way, it reveals the company's success at turning shareholder investments into profits.
See our latest analysis for Alphabet
How To Calculate Return On Equity?
Return on equity can be calculated by using the formula:
Return on Equity = Net Profit (from continuing operations) ÷ Shareholders' Equity
So, based on the above formula, the ROE for Alphabet is:
29% = US$88b ÷ US$301b (Based on the trailing twelve months to June 2024).
The 'return' is the amount earned after tax over the last twelve months. That means that for every $1 worth of shareholders' equity, the company generated $0.29 in profit.
What Has ROE Got To Do With Earnings Growth?
Thus far, we have learned that ROE measures how efficiently a company is generating its profits. Depending on how much of these profits the company reinvests or "retains", and how effectively it does so, we are then able to assess a company’s earnings growth potential. Assuming everything else remains unchanged, the higher the ROE and profit retention, the higher the growth rate of a company compared to companies that don't necessarily bear these characteristics.
Alphabet's Earnings Growth And 29% ROE
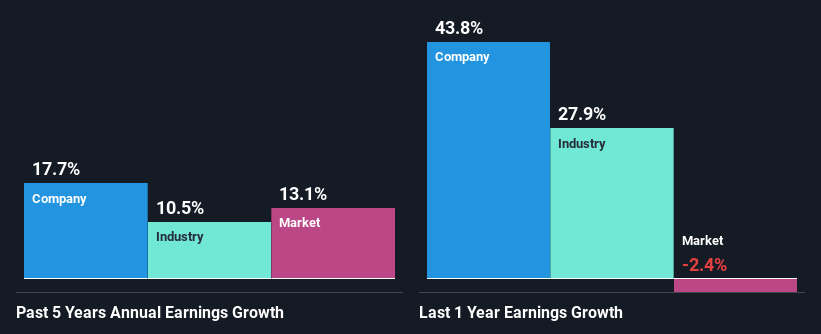
First thing first, we like that Alphabet has an impressive ROE. Additionally, the company's ROE is higher compared to the industry average of 6.9% which is quite remarkable. Probably as a result of this, Alphabet was able to see a decent net income growth of 18% over the last five years.
Next, on comparing with the industry net income growth, we found that Alphabet's growth is quite high when compared to the industry average growth of 11% in the same period, which is great to see.
The basis for attaching value to a company is, to a great extent, tied to its earnings growth. It’s important for an investor to know whether the market has priced in the company's expected earnings growth (or decline). This then helps them determine if the stock is placed for a bright or bleak future. Has the market priced in the future outlook for GOOGL? You can find out in our latest intrinsic value infographic research report.
Is Alphabet Making Efficient Use Of Its Profits?
Alphabet has a low three-year median payout ratio of 2.8%, meaning that the company retains the remaining 97% of its profits. This suggests that the management is reinvesting most of the profits to grow the business.
Upon studying the latest analysts' consensus data, we found that the company's future payout ratio is expected to rise to 9.7% over the next three years. However, the company's ROE is not expected to change by much despite the higher expected payout ratio.
Conclusion
On the whole, we feel that Alphabet's performance has been quite good. Particularly, we like that the company is reinvesting heavily into its business, and at a high rate of return. Unsurprisingly, this has led to an impressive earnings growth. That being so, a study of the latest analyst forecasts show that the company is expected to see a slowdown in its future earnings growth. To know more about the latest analysts predictions for the company, check out this visualization of analyst forecasts for the company.
New: Manage All Your Stock Portfolios in One Place
We've created the ultimate portfolio companion for stock investors, and it's free.
• Connect an unlimited number of Portfolios and see your total in one currency
• Be alerted to new Warning Signs or Risks via email or mobile
• Track the Fair Value of your stocks
Have feedback on this article? Concerned about the content? Get in touch with us directly. Alternatively, email editorial-team (at) simplywallst.com.
This article by Simply Wall St is general in nature. We provide commentary based on historical data and analyst forecasts only using an unbiased methodology and our articles are not intended to be financial advice. It does not constitute a recommendation to buy or sell any stock, and does not take account of your objectives, or your financial situation. We aim to bring you long-term focused analysis driven by fundamental data. Note that our analysis may not factor in the latest price-sensitive company announcements or qualitative material. Simply Wall St has no position in any stocks mentioned.
About NasdaqGS:GOOGL
Alphabet
Offers various products and platforms in the United States, Europe, the Middle East, Africa, the Asia-Pacific, Canada, and Latin America.
Outstanding track record with excellent balance sheet.
Similar Companies
Market Insights

Advertisement
Community Narratives
Quality at a Premium. A time to watch, not to buy?
Fair Value US$154.56|29.3% undervalued
DA
Community Contributor
GRAB: The Super-App at the Heart of Southeast Asia’s Digital Boom
Fair Value US$6.60|7.0% undervalued
BL
Community Contributor
Verve Group to Surge with 51.61% Revenue Growth
Fair Value €6.00|65.0% undervalued
ME
Community Contributor