
Advertisement
- United States
- /
- Interactive Media and Services
- /
- NasdaqCM:DUO
Fangdd Network Group Ltd. (NASDAQ:DUO) Stock Catapults 132% Though Its Price And Business Still Lag The Industry
Fangdd Network Group Ltd. (NASDAQ:DUO) shareholders would be excited to see that the share price has had a great month, posting a 132% gain and recovering from prior weakness. Looking back a bit further, it's encouraging to see the stock is up 39% in the last year.
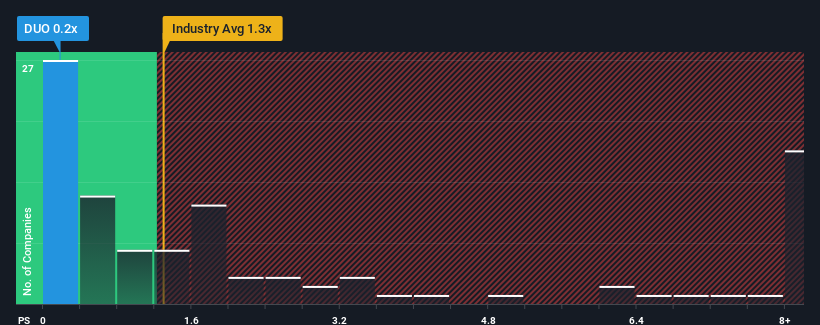
Although its price has surged higher, Fangdd Network Group may still be sending buy signals at present with its price-to-sales (or "P/S") ratio of 0.2x, considering almost half of all companies in the Interactive Media and Services industry in the United States have P/S ratios greater than 1.3x and even P/S higher than 4x aren't out of the ordinary. However, the P/S might be low for a reason and it requires further investigation to determine if it's justified.
Check out our latest analysis for Fangdd Network Group
What Does Fangdd Network Group's P/S Mean For Shareholders?
Revenue has risen at a steady rate over the last year for Fangdd Network Group, which is generally not a bad outcome. It might be that many expect the respectable revenue performance to degrade, which has repressed the P/S. If that doesn't eventuate, then existing shareholders may have reason to be optimistic about the future direction of the share price.
Although there are no analyst estimates available for Fangdd Network Group, take a look at this free data-rich visualisation to see how the company stacks up on earnings, revenue and cash flow.How Is Fangdd Network Group's Revenue Growth Trending?
The only time you'd be truly comfortable seeing a P/S as low as Fangdd Network Group's is when the company's growth is on track to lag the industry.
Taking a look back first, we see that the company managed to grow revenues by a handy 6.6% last year. However, this wasn't enough as the latest three year period has seen an unpleasant 87% overall drop in revenue. So unfortunately, we have to acknowledge that the company has not done a great job of growing revenue over that time.
Comparing that to the industry, which is predicted to deliver 13% growth in the next 12 months, the company's downward momentum based on recent medium-term revenue results is a sobering picture.
In light of this, it's understandable that Fangdd Network Group's P/S would sit below the majority of other companies. Nonetheless, there's no guarantee the P/S has reached a floor yet with revenue going in reverse. There's potential for the P/S to fall to even lower levels if the company doesn't improve its top-line growth.
The Final Word
Despite Fangdd Network Group's share price climbing recently, its P/S still lags most other companies. Typically, we'd caution against reading too much into price-to-sales ratios when settling on investment decisions, though it can reveal plenty about what other market participants think about the company.
It's no surprise that Fangdd Network Group maintains its low P/S off the back of its sliding revenue over the medium-term. At this stage investors feel the potential for an improvement in revenue isn't great enough to justify a higher P/S ratio. Unless the recent medium-term conditions improve, they will continue to form a barrier for the share price around these levels.
You need to take note of risks, for example - Fangdd Network Group has 4 warning signs (and 3 which are concerning) we think you should know about.
It's important to make sure you look for a great company, not just the first idea you come across. So if growing profitability aligns with your idea of a great company, take a peek at this free list of interesting companies with strong recent earnings growth (and a low P/E).
New: AI Stock Screener & Alerts
Our new AI Stock Screener scans the market every day to uncover opportunities.
• Dividend Powerhouses (3%+ Yield)
• Undervalued Small Caps with Insider Buying
• High growth Tech and AI Companies
Or build your own from over 50 metrics.
Have feedback on this article? Concerned about the content? Get in touch with us directly. Alternatively, email editorial-team (at) simplywallst.com.
This article by Simply Wall St is general in nature. We provide commentary based on historical data and analyst forecasts only using an unbiased methodology and our articles are not intended to be financial advice. It does not constitute a recommendation to buy or sell any stock, and does not take account of your objectives, or your financial situation. We aim to bring you long-term focused analysis driven by fundamental data. Note that our analysis may not factor in the latest price-sensitive company announcements or qualitative material. Simply Wall St has no position in any stocks mentioned.
About NasdaqCM:DUO
Fangdd Network Group
An investment holding company, provides real estate information services through online platform in the People’s Republic of China.
Flawless balance sheet with low risk.
Similar Companies
Market Insights

Advertisement
Community Narratives
Kodiak AI - a potential 100 bagger opportunity?
Fair Value US$14.00|44.7% undervalued
DA
Community Contributor
A Fair Price for a Great Business Facing Real Threats
Fair Value US$383.06|13.0% undervalued
IM
Community Contributor
AXON And Shopify Integration Will Unlock Global Mobile Advertising
Fair Value US$646.30|0% overvalued
AN
Based on Analyst Price Targets