- United States
- /
- Chemicals
- /
- NYSEAM:FSI
Fewer Investors Than Expected Jumping On Flexible Solutions International Inc. (NYSEMKT:FSI)


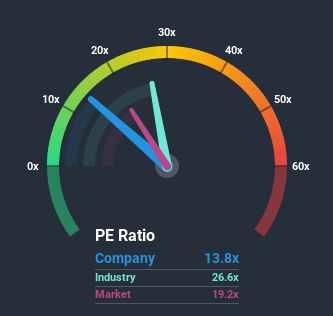
Flexible Solutions International Inc.'s (NYSEMKT:FSI) price-to-earnings (or "P/E") ratio of 13.8x might make it look like a buy right now compared to the market in the United States, where around half of the companies have P/E ratios above 20x and even P/E's above 38x are quite common. Although, it's not wise to just take the P/E at face value as there may be an explanation why it's limited.
With earnings that are retreating more than the market's of late, Flexible Solutions International has been very sluggish. It seems that many are expecting the dismal earnings performance to persist, which has repressed the P/E. You'd much rather the company wasn't bleeding earnings if you still believe in the business. If not, then existing shareholders will probably struggle to get excited about the future direction of the share price.
Check out our latest analysis for Flexible Solutions International
Is There Any Growth For Flexible Solutions International?
Flexible Solutions International's P/E ratio would be typical for a company that's only expected to deliver limited growth, and importantly, perform worse than the market.
If we review the last year of earnings, dishearteningly the company's profits fell to the tune of 25%. As a result, earnings from three years ago have also fallen 52% overall. Accordingly, shareholders would have felt downbeat about the medium-term rates of earnings growth.
Turning to the outlook, the next year should generate growth of 42% as estimated by the sole analyst watching the company. Meanwhile, the rest of the market is forecast to only expand by 3.7%, which is noticeably less attractive.
In light of this, it's peculiar that Flexible Solutions International's P/E sits below the majority of other companies. It looks like most investors are not convinced at all that the company can achieve future growth expectations.
The Bottom Line On Flexible Solutions International's P/E
It's argued the price-to-earnings ratio is an inferior measure of value within certain industries, but it can be a powerful business sentiment indicator.
We've established that Flexible Solutions International currently trades on a much lower than expected P/E since its forecast growth is higher than the wider market. When we see a strong earnings outlook with faster-than-market growth, we assume potential risks are what might be placing significant pressure on the P/E ratio. At least price risks look to be very low, but investors seem to think future earnings could see a lot of volatility.
Don't forget that there may be other risks. For instance, we've identified 4 warning signs for Flexible Solutions International that you should be aware of.
You might be able to find a better investment than Flexible Solutions International. If you want a selection of possible candidates, check out this free list of interesting companies that trade on a P/E below 20x (but have proven they can grow earnings).
If you’re looking to trade Flexible Solutions International, open an account with the lowest-cost* platform trusted by professionals, Interactive Brokers. Their clients from over 200 countries and territories trade stocks, options, futures, forex, bonds and funds worldwide from a single integrated account. Promoted
If you're looking to trade Flexible Solutions International, open an account with the lowest-cost platform trusted by professionals, Interactive Brokers.
With clients in over 200 countries and territories, and access to 160 markets, IBKR lets you trade stocks, options, futures, forex, bonds and funds from a single integrated account.
Enjoy no hidden fees, no account minimums, and FX conversion rates as low as 0.03%, far better than what most brokers offer.
Sponsored ContentNew: AI Stock Screener & Alerts
Our new AI Stock Screener scans the market every day to uncover opportunities.
• Dividend Powerhouses (3%+ Yield)
• Undervalued Small Caps with Insider Buying
• High growth Tech and AI Companies
Or build your own from over 50 metrics.
This article by Simply Wall St is general in nature. It does not constitute a recommendation to buy or sell any stock, and does not take account of your objectives, or your financial situation. We aim to bring you long-term focused analysis driven by fundamental data. Note that our analysis may not factor in the latest price-sensitive company announcements or qualitative material. Simply Wall St has no position in any stocks mentioned.
*Interactive Brokers Rated Lowest Cost Broker by StockBrokers.com Annual Online Review 2020
Have feedback on this article? Concerned about the content? Get in touch with us directly. Alternatively, email editorial-team@simplywallst.com.
About NYSEAM:FSI
Flexible Solutions International
Develops, manufactures, and markets specialty chemicals that slow the evaporation of water in Canada, the United States, and internationally.
Flawless balance sheet with high growth potential.
Similar Companies
Market Insights

Community Narratives

