
Advertisement

Legendary fund manager Li Lu (who Charlie Munger backed) once said, 'The biggest investment risk is not the volatility of prices, but whether you will suffer a permanent loss of capital.' When we think about how risky a company is, we always like to look at its use of debt, since debt overload can lead to ruin. We note that Valhi, Inc. (NYSE:VHI) does have debt on its balance sheet. But is this debt a concern to shareholders?
What Risk Does Debt Bring?
Debt is a tool to help businesses grow, but if a business is incapable of paying off its lenders, then it exists at their mercy. If things get really bad, the lenders can take control of the business. However, a more common (but still painful) scenario is that it has to raise new equity capital at a low price, thus permanently diluting shareholders. Having said that, the most common situation is where a company manages its debt reasonably well - and to its own advantage. The first thing to do when considering how much debt a business uses is to look at its cash and debt together.
View our latest analysis for Valhi
How Much Debt Does Valhi Carry?
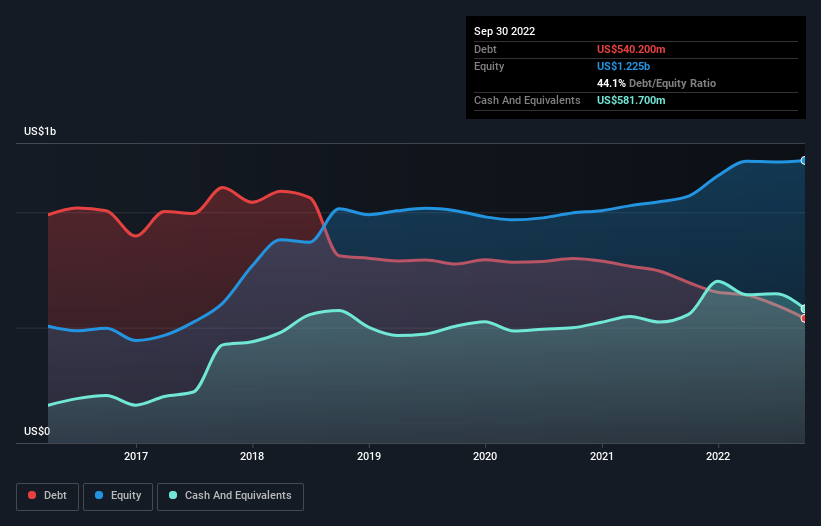
The image below, which you can click on for greater detail, shows that Valhi had debt of US$540.2m at the end of September 2022, a reduction from US$695.5m over a year. However, its balance sheet shows it holds US$581.7m in cash, so it actually has US$41.5m net cash.
How Healthy Is Valhi's Balance Sheet?
We can see from the most recent balance sheet that Valhi had liabilities of US$487.5m falling due within a year, and liabilities of US$1.13b due beyond that. Offsetting this, it had US$581.7m in cash and US$386.4m in receivables that were due within 12 months. So its liabilities total US$651.6m more than the combination of its cash and short-term receivables.
This is a mountain of leverage relative to its market capitalization of US$687.5m. Should its lenders demand that it shore up the balance sheet, shareholders would likely face severe dilution. Despite its noteworthy liabilities, Valhi boasts net cash, so it's fair to say it does not have a heavy debt load!
On top of that, Valhi grew its EBIT by 69% over the last twelve months, and that growth will make it easier to handle its debt. There's no doubt that we learn most about debt from the balance sheet. But it is Valhi's earnings that will influence how the balance sheet holds up in the future. So if you're keen to discover more about its earnings, it might be worth checking out this graph of its long term earnings trend.
But our final consideration is also important, because a company cannot pay debt with paper profits; it needs cold hard cash. Valhi may have net cash on the balance sheet, but it is still interesting to look at how well the business converts its earnings before interest and tax (EBIT) to free cash flow, because that will influence both its need for, and its capacity to manage debt. During the last three years, Valhi generated free cash flow amounting to a very robust 83% of its EBIT, more than we'd expect. That positions it well to pay down debt if desirable to do so.
Summing Up
Although Valhi's balance sheet isn't particularly strong, due to the total liabilities, it is clearly positive to see that it has net cash of US$41.5m. And it impressed us with free cash flow of US$226m, being 83% of its EBIT. So is Valhi's debt a risk? It doesn't seem so to us. When analysing debt levels, the balance sheet is the obvious place to start. However, not all investment risk resides within the balance sheet - far from it. Case in point: We've spotted 1 warning sign for Valhi you should be aware of.
When all is said and done, sometimes its easier to focus on companies that don't even need debt. Readers can access a list of growth stocks with zero net debt 100% free, right now.
New: Manage All Your Stock Portfolios in One Place
We've created the ultimate portfolio companion for stock investors, and it's free.
• Connect an unlimited number of Portfolios and see your total in one currency
• Be alerted to new Warning Signs or Risks via email or mobile
• Track the Fair Value of your stocks
Have feedback on this article? Concerned about the content? Get in touch with us directly. Alternatively, email editorial-team (at) simplywallst.com.
This article by Simply Wall St is general in nature. We provide commentary based on historical data and analyst forecasts only using an unbiased methodology and our articles are not intended to be financial advice. It does not constitute a recommendation to buy or sell any stock, and does not take account of your objectives, or your financial situation. We aim to bring you long-term focused analysis driven by fundamental data. Note that our analysis may not factor in the latest price-sensitive company announcements or qualitative material. Simply Wall St has no position in any stocks mentioned.
About NYSE:VHI
Valhi
Engages in the chemicals, component products, and real estate management and development businesses in Europe, North America, the Asia Pacific, and internationally.
Excellent balance sheet second-rate dividend payer.
Market Insights


Advertisement
Community Narratives
Nike's Direct-to-Consumer Focus Will Drive Future Growth
Fair Value US$87.90|22.7% undervalued
UN
Community Contributor
Novo Nordisk will dominate GLP-1 market with Ozempic and Wegovy growth
Fair Value US$89.59|14.2% undervalued
BE
Community Contributor
Rheinmetall could get 20-25% of EU-NATO 3%-GDP defence spending
Fair Value €7.57k|82.8% undervalued
NO
Community Contributor