Advertisement
- United States
- /
- Chemicals
- /
- NYSE:SHW
How Does Sherwin-Williams Stack Up After Its 10% Drop This Year?

Reviewed by Bailey Pemberton
If you're sizing up Sherwin-Williams and wondering whether it's time to buy, hold, or steer clear, you're certainly not alone. With this stock, the story is never just about paint. It's about reading between the lines and figuring out what those price swings really mean for long-term investors like you. Over the past week, Sherwin-Williams slipped by 1.1%, rounding out a 10% dip for the last month. Even with those declines, it's still up a modest 1.3% so far this year. But look back a bit further and the plot thickens: after surging 72.1% over three years and 52.5% over five, this last year has been rougher, with the stock losing 10.2%.
Some of these moves have mirrored broader market shifts, but there has also been a major focus on potential changes in demand for paint and coatings, especially as the housing market cools and industrial projects ebb and flow. Despite recent volatility, many investors are asking if these price drops have revealed a bargain or simply reset expectations for growth ahead.
On the valuation front, Sherwin-Williams currently scores 0 out of 6 in undervaluation checks. That means, by traditional yardsticks, it does not flash as a steal right now. However, valuation is not always as simple as a checklist, and the real insight often comes from digging into how the numbers line up across different methods. Before you make your next move, let’s explore what those approaches tell us. Stay tuned, because at the end, we will look at a perspective most investors overlook.
Sherwin-Williams scores just 0/6 on our valuation checks. See what other red flags we found in the full valuation breakdown.
Approach 1: Sherwin-Williams Discounted Cash Flow (DCF) Analysis
A Discounted Cash Flow (DCF) model estimates a company's intrinsic value by projecting its future cash flows and discounting them back to today, reflecting the time value of money. For Sherwin-Williams, the DCF calculation uses a two-stage Free Cash Flow to Equity approach. This means it considers both near-term and long-term cash flow growth.
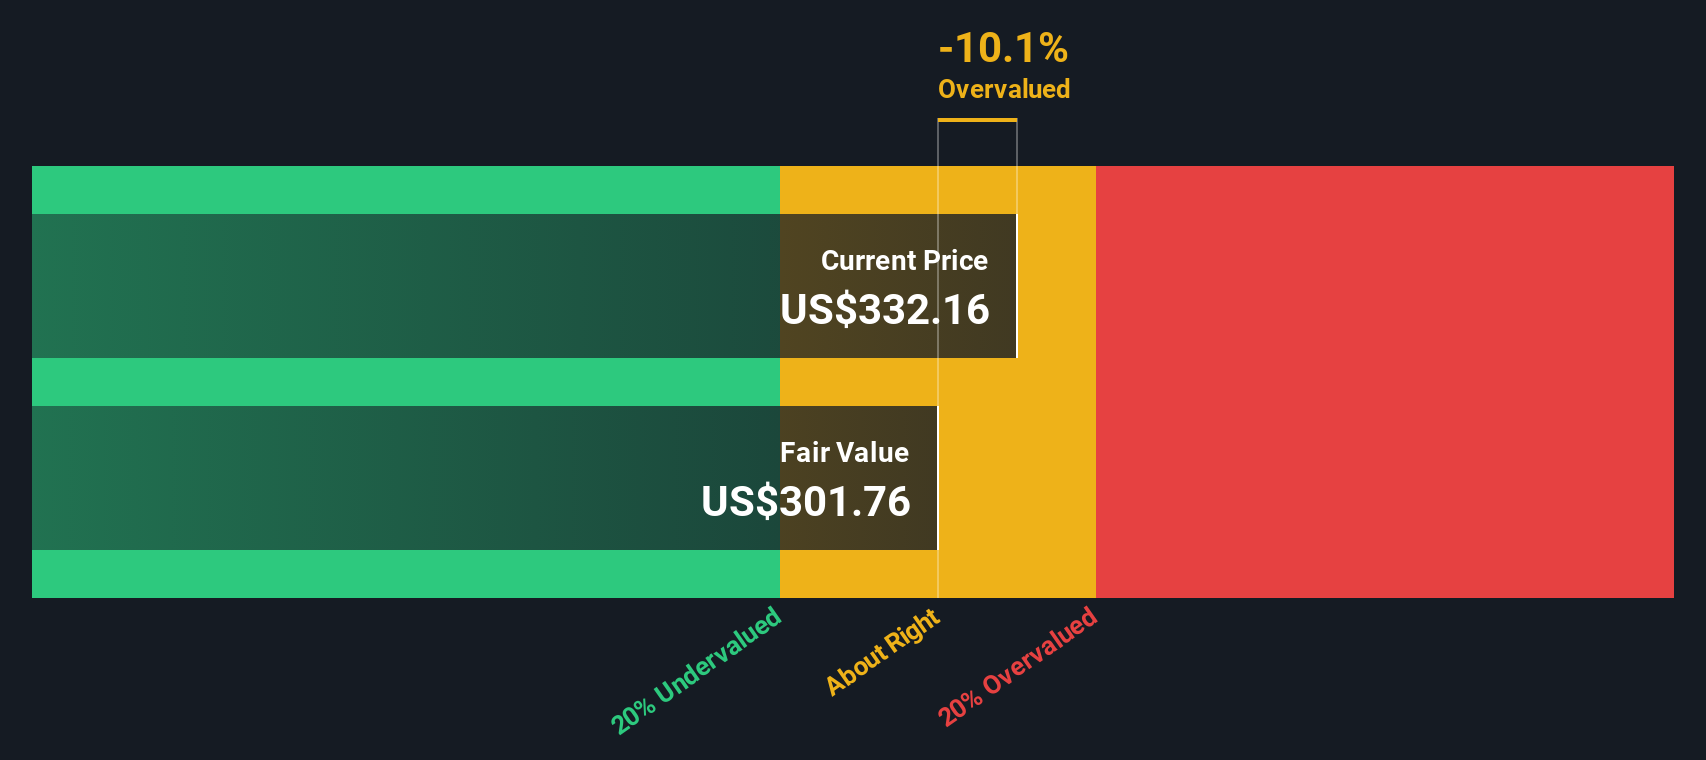
Currently, Sherwin-Williams generates about $2.15 Billion in Free Cash Flow. Analysts expect this figure to grow steadily, reaching approximately $3.56 Billion by 2028. Beyond that, Simply Wall St extrapolates further Free Cash Flow growth and projects it could climb above $4.5 Billion within the next decade. These projections highlight a positive growth trajectory, but it is important to remember that longer-term numbers become increasingly uncertain the further out you look.
Taking all these cash flow projections into account, the DCF model calculates an intrinsic value of $301.49 per share for Sherwin-Williams. This figure is about 12.0% below the company’s recent trading price, signaling the stock is currently overvalued according to this method.
Result: OVERVALUED
Our Discounted Cash Flow (DCF) analysis suggests Sherwin-Williams may be overvalued by 12.0%. Find undervalued stocks or create your own screener to find better value opportunities.
Approach 2: Sherwin-Williams Price vs Earnings
The Price-to-Earnings (PE) ratio is a popular way to value profitable companies like Sherwin-Williams. It tells investors how much they are paying for each dollar of earnings, making it a useful quick check on whether a stock is priced reasonably. Generally, companies with higher growth prospects or lower risk can justify higher PE ratios, while slower growth or greater uncertainty should lead to a lower multiple.
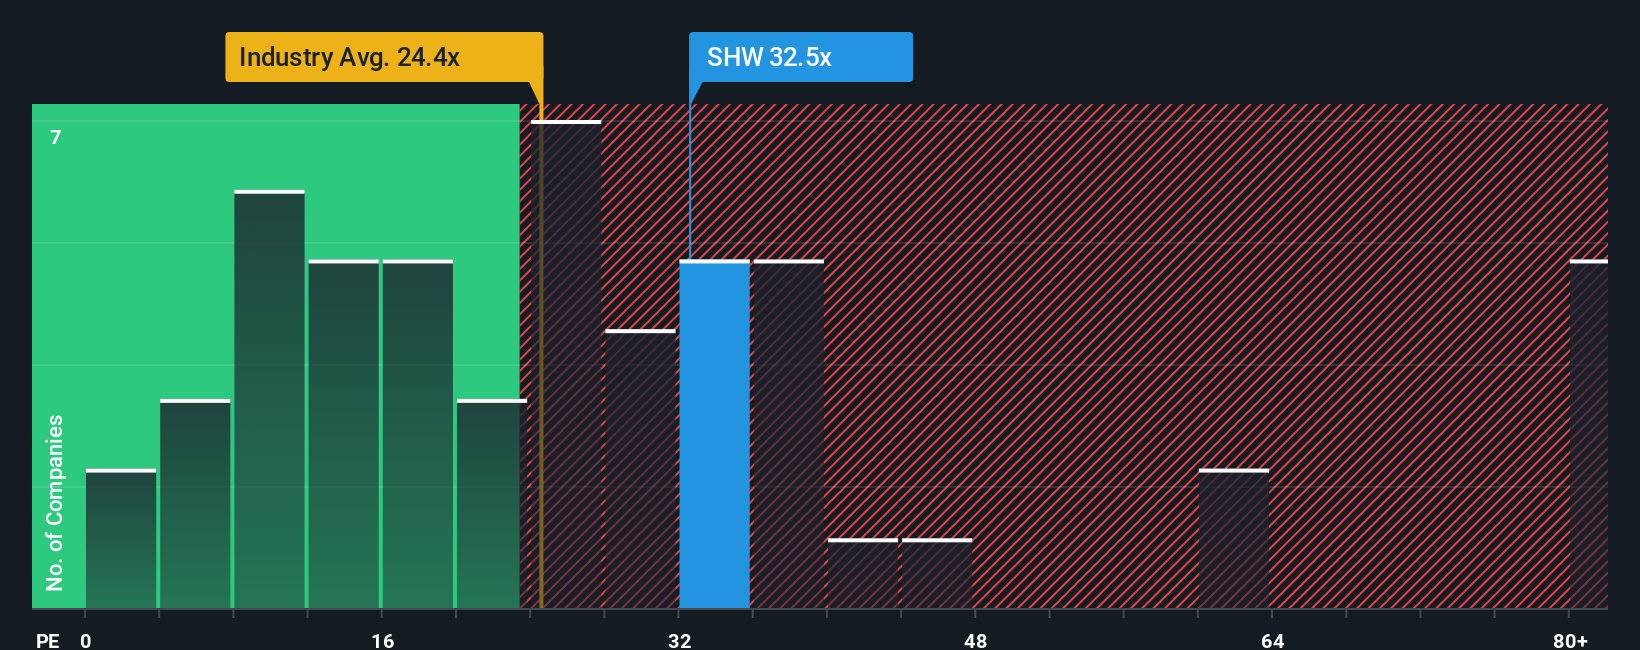
Right now, Sherwin-Williams trades at a PE of 33x. For context, the average PE across its direct peers sits at 23.4x, while the broader chemicals industry averages 26.4x. That means Sherwin-Williams is being valued at a clear premium compared to these yardsticks.
To go a step further, Simply Wall St calculates a “Fair Ratio,” which in this case is 24.6x. This figure reflects factors such as Sherwin-Williams’ growth outlook, profitability, risk profile, and market capitalization. It is more informative than just a straight comparison with other companies, as it takes into account the qualities unique to Sherwin-Williams and its specific industry position.
With a current PE of 33x compared to the Fair Ratio of 24.6x, shares appear to be priced above what is justified by the company’s fundamentals. This supports the earlier DCF conclusion that the stock looks overvalued at current levels.
Result: OVERVALUED
PE ratios tell one story, but what if the real opportunity lies elsewhere? Discover companies where insiders are betting big on explosive growth.
Upgrade Your Decision Making: Choose your Sherwin-Williams Narrative
Earlier we mentioned that there is an even better way to understand valuation, so let's introduce you to Narratives. A Narrative is a simple tool that lets you tell your story, or your perspective on a company, by combining your own expectations for future earnings, revenue, and profit margins into a personal financial forecast and fair value. Narratives link the story of a business to the numbers, helping investors see not just what the company is worth today, but what it could be worth in different futures.
On Simply Wall St’s Community page, Narratives are easy to create and used by millions of investors. They update automatically when new facts, such as earnings or news, come in, so your investment view always keeps pace with reality. By comparing the Fair Value from your Narrative with today’s market price, you can quickly see whether you think it is a time to buy, hold, or sell.
For example, some investors are optimistic that Sherwin-Williams will capture new market share and boost margins, assigning a Fair Value of $420 per share, while more cautious investors foresee tighter growth and assign just $258. This shows how your view of the company’s story can shape your investment decisions.
Do you think there's more to the story for Sherwin-Williams? Create your own Narrative to let the Community know!

This article by Simply Wall St is general in nature. We provide commentary based on historical data and analyst forecasts only using an unbiased methodology and our articles are not intended to be financial advice. It does not constitute a recommendation to buy or sell any stock, and does not take account of your objectives, or your financial situation. We aim to bring you long-term focused analysis driven by fundamental data. Note that our analysis may not factor in the latest price-sensitive company announcements or qualitative material. Simply Wall St has no position in any stocks mentioned.
New: Manage All Your Stock Portfolios in One Place
We've created the ultimate portfolio companion for stock investors, and it's free.
• Connect an unlimited number of Portfolios and see your total in one currency
• Be alerted to new Warning Signs or Risks via email or mobile
• Track the Fair Value of your stocks
Have feedback on this article? Concerned about the content? Get in touch with us directly. Alternatively, email editorial-team@simplywallst.com
About NYSE:SHW
Sherwin-Williams
Engages in the development, manufacture, distribution, and sale of paint, coatings, and related products to professional, industrial, commercial and retail customers.
Average dividend payer with mediocre balance sheet.
Similar Companies
Market Insights


Advertisement
Weekly Picks
LO


Lou_Basenese on Virtuix Holdings ·
From a “Shark Tank” Snub to an Air Force “Yes”: Why Virtuix at $3.50 May Be the Market’s Most Mispriced AI Story
Fair Value:US$7.551.2% undervalued
14 followersusers have followed this narrative
0 commentsusers have commented on this narrative
2 likesusers have liked this narrative
IN


Investingwilly on Mastercard ·
Mastercard: The Best Dividend Stock You're Ignoring
Fair Value:US$75034.1% undervalued
44 followersusers have followed this narrative
1 commentusers have commented on this narrative
6 likesusers have liked this narrative
TR


tripledub on Intuit ·
A Wonderful Business at a Not-So-Wonderful Price
Fair Value:US$56053.2% undervalued
61 followersusers have followed this narrative
2 commentsusers have commented on this narrative
29 likesusers have liked this narrative
TA


Talos on MindWalk Holdings ·
The Asymmetric TechBio Play: MindWalk Holdings and the Valuation Disconnect
Fair Value:US$8.2781.3% undervalued
30 followersusers have followed this narrative
0 commentsusers have commented on this narrative
8 likesusers have liked this narrative
Recently Updated Narratives
BR


Brunhilde_Wagner on Gentex ·
Fair Value=$27; high-quality niche industrial w/ real moat; excellent FCF conversion.
Fair Value:US$24.641.6% overvalued
1 followerusers have followed this narrative
0 commentsusers have commented on this narrative
0 likesusers have liked this narrative
MA


martinarauz on Meta Platforms ·
Meta Platforms: A Cash Flow Machine in the Age of AI
Fair Value:US$983.343.3% undervalued
1 followerusers have followed this narrative
0 commentsusers have commented on this narrative
0 likesusers have liked this narrative
MA

Maturity_Koala_snzw on VivoPower ·
Rating: Speculative Buy
Fair Value:US$938.7% undervalued
2 followersusers have followed this narrative
0 commentsusers have commented on this narrative
0 likesusers have liked this narrative
Popular Narratives
MA

martinarauz on Nu Holdings ·
Investment Analysis (May 2026)
Fair Value:US$22.7445.2% undervalued
67 followersusers have followed this narrative
0 commentsusers have commented on this narrative
16 likesusers have liked this narrative
HA


HarishPK on Adobe ·
Adobe: A Probabilistic Case for Undervaluation
Fair Value:US$319.9638.6% undervalued
61 followersusers have followed this narrative
9 commentsusers have commented on this narrative
18 likesusers have liked this narrative
HE


HedgeY on AST SpaceMobile ·
AST SpaceMobile: The Boldest Direct-to-Cell Bet in Public Markets
Fair Value:US$17060.0% undervalued
51 followersusers have followed this narrative
0 commentsusers have commented on this narrative
13 likesusers have liked this narrative
