- United States
- /
- Metals and Mining
- /
- NYSE:NEXA
These Return Metrics Don't Make Nexa Resources (NYSE:NEXA) Look Too Strong

What financial metrics can indicate to us that a company is maturing or even in decline? Businesses in decline often have two underlying trends, firstly, a declining return on capital employed (ROCE) and a declining base of capital employed. Trends like this ultimately mean the business is reducing its investments and also earning less on what it has invested. And from a first read, things don't look too good at Nexa Resources (NYSE:NEXA), so let's see why.
What Is Return On Capital Employed (ROCE)?
For those that aren't sure what ROCE is, it measures the amount of pre-tax profits a company can generate from the capital employed in its business. To calculate this metric for Nexa Resources, this is the formula:
Return on Capital Employed = Earnings Before Interest and Tax (EBIT) ÷ (Total Assets - Current Liabilities)
0.01 = US$38m ÷ (US$4.7b - US$1.0b) (Based on the trailing twelve months to June 2024).
So, Nexa Resources has an ROCE of 1.0%. In absolute terms, that's a low return and it also under-performs the Metals and Mining industry average of 9.4%.
See our latest analysis for Nexa Resources
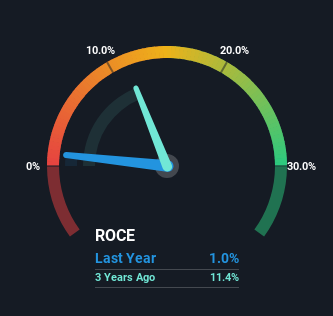
Above you can see how the current ROCE for Nexa Resources compares to its prior returns on capital, but there's only so much you can tell from the past. If you'd like, you can check out the forecasts from the analysts covering Nexa Resources for free.
What The Trend Of ROCE Can Tell Us
The trend of ROCE at Nexa Resources is showing some signs of weakness. Unfortunately, returns have declined substantially over the last five years to the 1.0% we see today. In addition to that, Nexa Resources is now employing 28% less capital than it was five years ago. The fact that both are shrinking is an indication that the business is going through some tough times. If these underlying trends continue, we wouldn't be too optimistic going forward.
While on the subject, we noticed that the ratio of current liabilities to total assets has risen to 22%, which has impacted the ROCE. Without this increase, it's likely that ROCE would be even lower than 1.0%. Keep an eye on this ratio, because the business could encounter some new risks if this metric gets too high.
Our Take On Nexa Resources' ROCE
In summary, it's unfortunate that Nexa Resources is shrinking its capital base and also generating lower returns. Investors haven't taken kindly to these developments, since the stock has declined 26% from where it was five years ago. With underlying trends that aren't great in these areas, we'd consider looking elsewhere.
If you'd like to know about the risks facing Nexa Resources, we've discovered 1 warning sign that you should be aware of.
For those who like to invest in solid companies, check out this free list of companies with solid balance sheets and high returns on equity.
The New Payments ETF Is Live on NASDAQ:
Money is moving to real-time rails, and a newly listed ETF now gives investors direct exposure. Fast settlement. Institutional custody. Simple access.
Explore how this launch could reshape portfolios
Sponsored ContentValuation is complex, but we're here to simplify it.
Discover if Nexa Resources might be undervalued or overvalued with our detailed analysis, featuring fair value estimates, potential risks, dividends, insider trades, and its financial condition.
Access Free AnalysisHave feedback on this article? Concerned about the content? Get in touch with us directly. Alternatively, email editorial-team (at) simplywallst.com.
This article by Simply Wall St is general in nature. We provide commentary based on historical data and analyst forecasts only using an unbiased methodology and our articles are not intended to be financial advice. It does not constitute a recommendation to buy or sell any stock, and does not take account of your objectives, or your financial situation. We aim to bring you long-term focused analysis driven by fundamental data. Note that our analysis may not factor in the latest price-sensitive company announcements or qualitative material. Simply Wall St has no position in any stocks mentioned.
About NYSE:NEXA
Nexa Resources
Engages in the zinc mining and smelting business worldwide.
Undervalued with moderate growth potential.
Market Insights

Weekly Picks

Early mover in a fast growing industry. Likely to experience share price volatility as they scale


A case for CA$31.80 (undiluted), aka 8,616% upside from CA$0.37 (an 86 bagger!).


Moderation and Stabilisation: HOLD: Fair Price based on a 4-year Cycle is $12.08
Recently Updated Narratives

Airbnb Stock: Platform Growth in a World of Saturation and Scrutiny

Adobe Stock: AI-Fueled ARR Growth Pushes Guidance Higher, But Cost Pressures Loom

Thomson Reuters Stock: When Legal Intelligence Becomes Mission-Critical Infrastructure
Popular Narratives


Crazy Undervalued 42 Baggers Silver Play (Active & Running Mine)


NVDA: Expanding AI Demand Will Drive Major Data Center Investments Through 2026

The AI Infrastructure Giant Grows Into Its Valuation
Trending Discussion

