- United States
- /
- Metals and Mining
- /
- NYSE:NEM
What Newmont Corporation's (NYSE:NEM) P/S Is Not Telling You


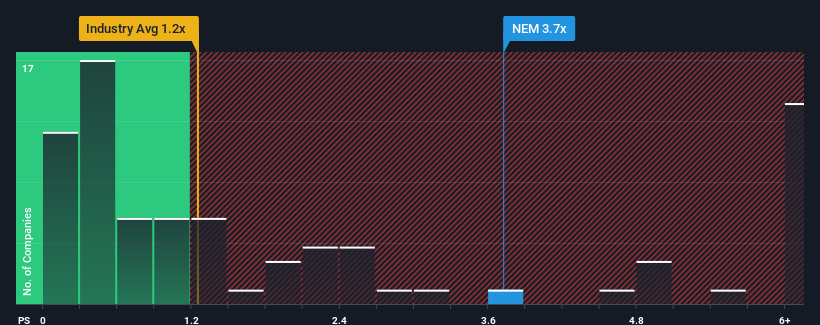
Newmont Corporation's (NYSE:NEM) price-to-sales (or "P/S") ratio of 3.7x may look like a poor investment opportunity when you consider close to half the companies in the Metals and Mining industry in the United States have P/S ratios below 1.2x. However, the P/S might be quite high for a reason and it requires further investigation to determine if it's justified.
See our latest analysis for Newmont
What Does Newmont's P/S Mean For Shareholders?
Recent times have been advantageous for Newmont as its revenues have been rising faster than most other companies. It seems that many are expecting the strong revenue performance to persist, which has raised the P/S. You'd really hope so, otherwise you're paying a pretty hefty price for no particular reason.
If you'd like to see what analysts are forecasting going forward, you should check out our free report on Newmont.Do Revenue Forecasts Match The High P/S Ratio?
Newmont's P/S ratio would be typical for a company that's expected to deliver very strong growth, and importantly, perform much better than the industry.
If we review the last year of revenue growth, the company posted a worthy increase of 14%. The latest three year period has also seen a 12% overall rise in revenue, aided somewhat by its short-term performance. So we can start by confirming that the company has actually done a good job of growing revenue over that time.
Shifting to the future, estimates from the analysts covering the company suggest revenue should grow by 13% each year over the next three years. That's shaping up to be similar to the 13% per year growth forecast for the broader industry.
With this in consideration, we find it intriguing that Newmont's P/S is higher than its industry peers. Apparently many investors in the company are more bullish than analysts indicate and aren't willing to let go of their stock right now. Although, additional gains will be difficult to achieve as this level of revenue growth is likely to weigh down the share price eventually.
What We Can Learn From Newmont's P/S?
Generally, our preference is to limit the use of the price-to-sales ratio to establishing what the market thinks about the overall health of a company.
Seeing as its revenues are forecast to grow in line with the wider industry, it would appear that Newmont currently trades on a higher than expected P/S. The fact that the revenue figures aren't setting the world alight has us doubtful that the company's elevated P/S can be sustainable for the long term. Unless the company can jump ahead of the rest of the industry in the short-term, it'll be a challenge to maintain the share price at current levels.
Plus, you should also learn about these 2 warning signs we've spotted with Newmont (including 1 which is concerning).
It's important to make sure you look for a great company, not just the first idea you come across. So if growing profitability aligns with your idea of a great company, take a peek at this free list of interesting companies with strong recent earnings growth (and a low P/E).
Valuation is complex, but we're here to simplify it.
Discover if Newmont might be undervalued or overvalued with our detailed analysis, featuring fair value estimates, potential risks, dividends, insider trades, and its financial condition.
Access Free AnalysisHave feedback on this article? Concerned about the content? Get in touch with us directly. Alternatively, email editorial-team (at) simplywallst.com.
This article by Simply Wall St is general in nature. We provide commentary based on historical data and analyst forecasts only using an unbiased methodology and our articles are not intended to be financial advice. It does not constitute a recommendation to buy or sell any stock, and does not take account of your objectives, or your financial situation. We aim to bring you long-term focused analysis driven by fundamental data. Note that our analysis may not factor in the latest price-sensitive company announcements or qualitative material. Simply Wall St has no position in any stocks mentioned.
About NYSE:NEM
Undervalued with excellent balance sheet.

