Advertisement
- United States
- /
- Metals and Mining
- /
- NYSE:NEM
Is Newmont a Value Opportunity After Steep Job Cut Plans and $15B Acquisition?

Simply Wall St
Reviewed by Bailey Pemberton
Deciding what to do with Newmont stock right now? You are not alone. After all, it has been nothing short of a roller coaster for this gold mining giant, with its price climbing 14.0% over the past month and an eye-popping 126.4% since the start of the year. If you are weighing your options, the company’s headline-making moves are giving plenty to think about. From the recent news of possible deep job cuts after a $15 billion acquisition, to buzz around undervaluation as gold and silver prices rise, there is much to consider.
Investors have started to notice. In just the last week, Newmont gained another 2.7%. There is also a growing perception that risks around the company are changing, especially as regulations around gold, like the White House’s planned clarification on tariffs, create more predictable conditions for the industry.
But what about valuation, the question that sits at the heart of every stock decision? By standard metrics, Newmont currently passes 3 out of 6 key “undervaluation” checks. This value score suggests the stock may still have room to run, compared to both flashy upstarts and more expensive blue chips. Of course, no checklist can capture the whole story, and the way we look at value can make all the difference. Next, let’s break down exactly how Newmont measures up across the most important valuation methods. There is an even smarter way to understand value, which we will circle back to at the end of this article.
Approach 1: Newmont Discounted Cash Flow (DCF) Analysis
The Discounted Cash Flow (DCF) model estimates a company's intrinsic value by projecting its future cash flows and discounting them back to today's value. This allows investors to determine what the business is truly worth right now. For Newmont, this involves looking at current and future Free Cash Flow (FCF), with projections informed by both analyst estimates and extrapolation for years beyond analyst coverage.
At present, Newmont's Free Cash Flow stands at $4.72 billion. Analyst forecasts see FCF growing to as much as $6.65 billion by 2028. After that, Simply Wall St extends projections through to 2035, reaching around $4.94 billion in that year. These estimates reflect both periods of growth and some moderation in later years, providing a long-term picture of steady cash generation.
Based on these projections, the DCF model arrives at an intrinsic value of $81.83 per share. Compared to Newmont's recent share price, this results in an intrinsic discount of -6.2%, implying the stock is just a little above what the long-term cash flow would suggest is fair value.
Result: ABOUT RIGHT

Simply Wall St performs a valuation analysis on every stock in the world every day (check out Newmont's valuation analysis). We show the entire calculation in full. You can track the result in your watchlist or portfolio and be alerted when this changes.
Approach 2: Newmont Price vs Earnings (PE)
For profitable companies like Newmont, the Price-to-Earnings (PE) ratio remains a trusted way to assess value. The PE ratio helps investors compare what the market is willing to pay today for a company’s earnings. While a higher PE can be justified by stronger growth prospects or a lower risk profile, a lower PE sometimes signals value. However, it may also reflect market caution about future risks.
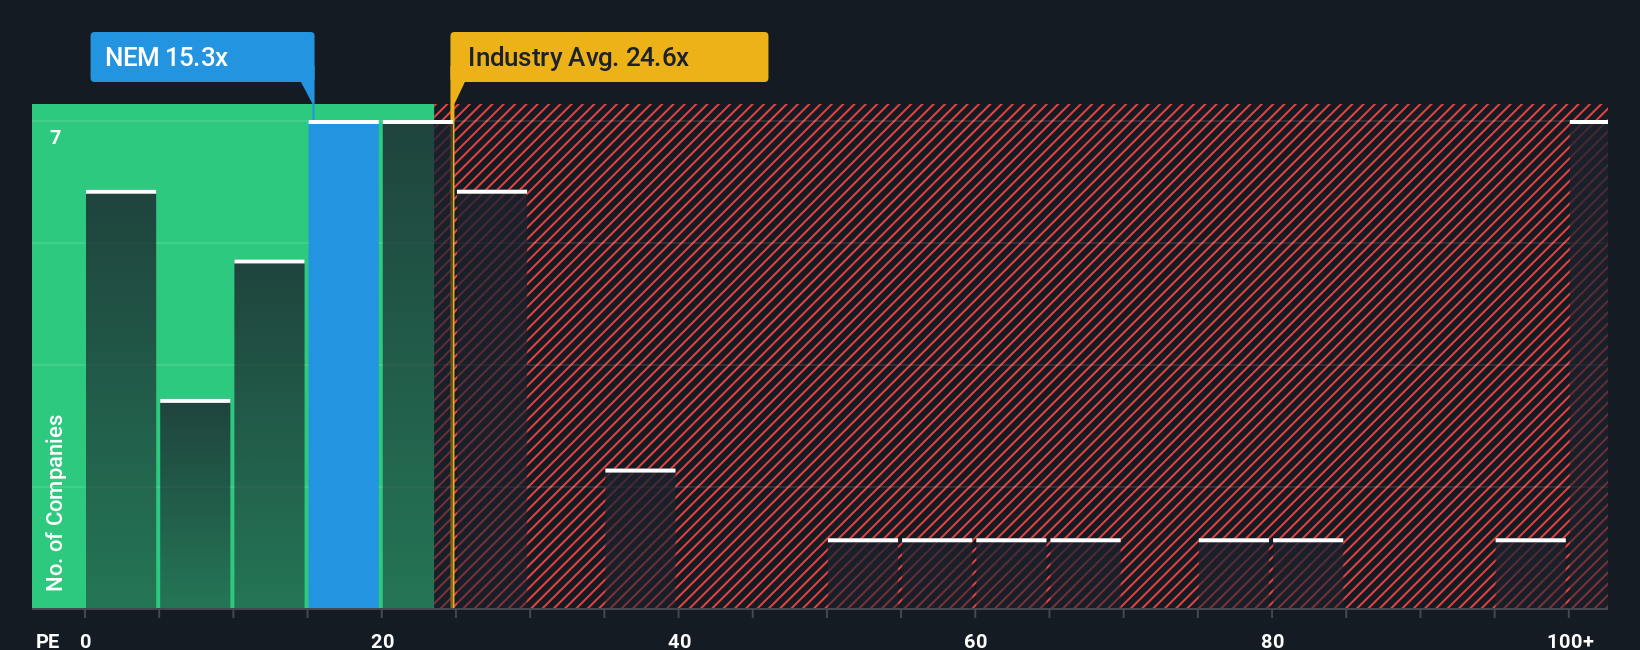
Newmont currently trades at a PE ratio of 15.27x. For perspective, the average PE for the Metals and Mining industry is 24.56x, with the company’s peer group averaging an even higher 35.43x. Based on these numbers, Newmont appears markedly cheaper than most of its industry competitors.
Not all companies with low PEs are true bargains. Simply Wall St’s proprietary "Fair Ratio," which accounts for differences in growth potential, profitability, market cap, and sector risks, estimates that a more appropriate PE for Newmont is 24.25x. This Fair Ratio is more tailored than a simple peer or industry comparison, as it blends company-specific dynamics with market realities.
With Newmont’s actual PE (15.27x) falling notably below its Fair Ratio (24.25x), the stock is trading at a significant discount relative to its expected value. This suggests the market may be underrating the company’s longer-term earnings potential compared to similar businesses.
Result: UNDERVALUED
PE ratios tell one story, but what if the real opportunity lies elsewhere? Discover companies where insiders are betting big on explosive growth.
Upgrade Your Decision Making: Choose your Newmont Narrative
Earlier we mentioned that there is an even better way to understand valuation, so let us introduce you to Narratives. A Narrative is your personal story about a company, connecting what is happening in its business with the numbers behind its future. You define your own expectations for Newmont’s future revenue, profits, and margins, and see how these drive a fair value today.
Instead of relying solely on rigid models or consensus estimates, Narratives invite you to craft your own view by combining financial analysis with your perspective on growth, industry shifts, risks, or company strategy. This approach empowers you to connect your beliefs about Newmont’s prospects to the current share price and decide whether there is an opportunity, straight from the Community page on Simply Wall St used by millions of investors.
Narratives are easy to update and dynamically reflect new information such as fresh earnings, news, or regulatory changes so your investment thesis stays up to date. When you compare your Narrative-based fair value with the latest market price, you can see in real time whether the risk and reward still matches your story, making your decision about buying or selling much clearer.
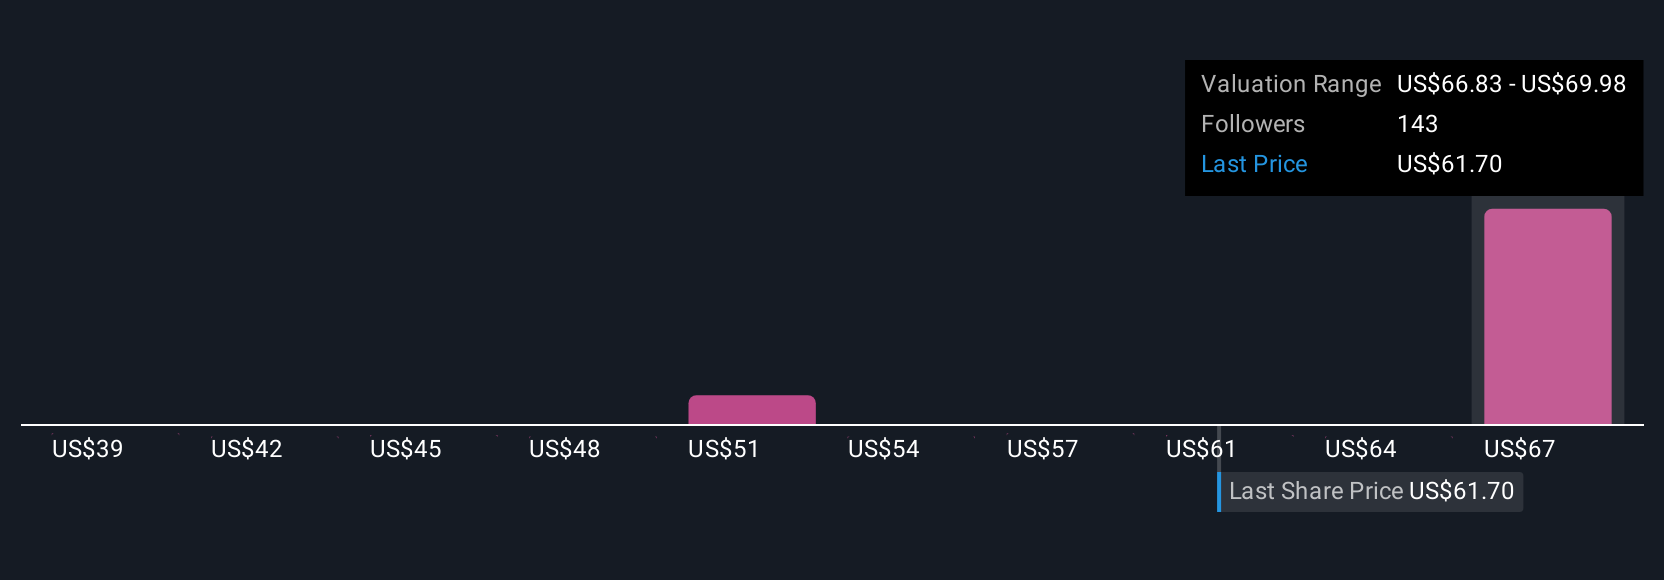
- For example, some investors see strong gold demand and successful asset integration, supporting future earnings and a $104 price target.
- Others anticipate operational risks and margin pressure, with a more cautious fair value of $58. Your unique Narrative determines where you stand.
Do you think there's more to the story for Newmont? Create your own Narrative to let the Community know!
This article by Simply Wall St is general in nature. We provide commentary based on historical data and analyst forecasts only using an unbiased methodology and our articles are not intended to be financial advice. It does not constitute a recommendation to buy or sell any stock, and does not take account of your objectives, or your financial situation. We aim to bring you long-term focused analysis driven by fundamental data. Note that our analysis may not factor in the latest price-sensitive company announcements or qualitative material. Simply Wall St has no position in any stocks mentioned.
Valuation is complex, but we're here to simplify it.
Discover if Newmont might be undervalued or overvalued with our detailed analysis, featuring fair value estimates, potential risks, dividends, insider trades, and its financial condition.
Access Free AnalysisHave feedback on this article? Concerned about the content? Get in touch with us directly. Alternatively, email editorial-team@simplywallst.com
About NYSE:NEM
Excellent balance sheet and fair value.
Similar Companies
Market Insights

Advertisement
Community Narratives
The Next Phase of Energy Storage: How NeoVolta Is Tackling America’s Power Crunch
Fair Value US$7.50|35.1% undervalued
MA
Community Contributor
Why EnSilica is Worth Possibly 13x its Current Price
Fair Value UK£5.00|89.8% undervalued
DO
Community Contributor
M&A Activity, Industry Diversification & A Defense Contract Monopoly Will Push BWXT For Healthy Long-Term Growth
Fair Value US$220.00|15.2% undervalued
CL
Community Contributor
A case for Cassiar Gold Corp (TSXV: GLDC) to reach CAD$8-10 before 2030 (X30-37)
Fair Value CA$10.00|96.0% undervalued
AG
Community Contributor