Advertisement
- United States
- /
- Chemicals
- /
- NYSE:FUL
Is There Now an Opportunity in H.B. Fuller After Recent 3% Weekly Gain?

Simply Wall St
Reviewed by Bailey Pemberton
Thinking about what to do with H.B. Fuller stock? You are not alone. With shares closing recently at $60.41, H.B. Fuller has been a conversation starter among investors navigating a market full of shake-ups and evolving opportunities. Over the past week, H.B. Fuller posted a 3.0% gain, which suggests some optimism has crept back onto the table after a rocky stretch. However, zooming out, the longer-term returns tell a different story: the stock is down nearly 22% over the past year and lags the market since the start of 2024.
It is hard to pinpoint a single news event behind these price moves, but shifts in investor sentiment and broader market developments, such as changes in materials demand and volatility in the chemicals sector, likely played their part. Over five years, the stock is still up 31.1%, proving it has staying power, even if recent returns have disappointed.
As for value, H.B. Fuller’s current valuation score sits at 2 out of 6, meaning it looks undervalued in two key areas. This is promising, but certainly not a slam dunk. If you are weighing whether now is a good entry point, understanding how those checks are stacked matters. So, how do the usual valuation methods measure up, and is there a smarter way to tell if the stock is truly a bargain? Let us break down what the numbers really say, and stick around for a fresh perspective on how to judge value that goes deeper than the basic metrics.
H.B. Fuller scores just 2/6 on our valuation checks. See what other red flags we found in the full valuation breakdown.
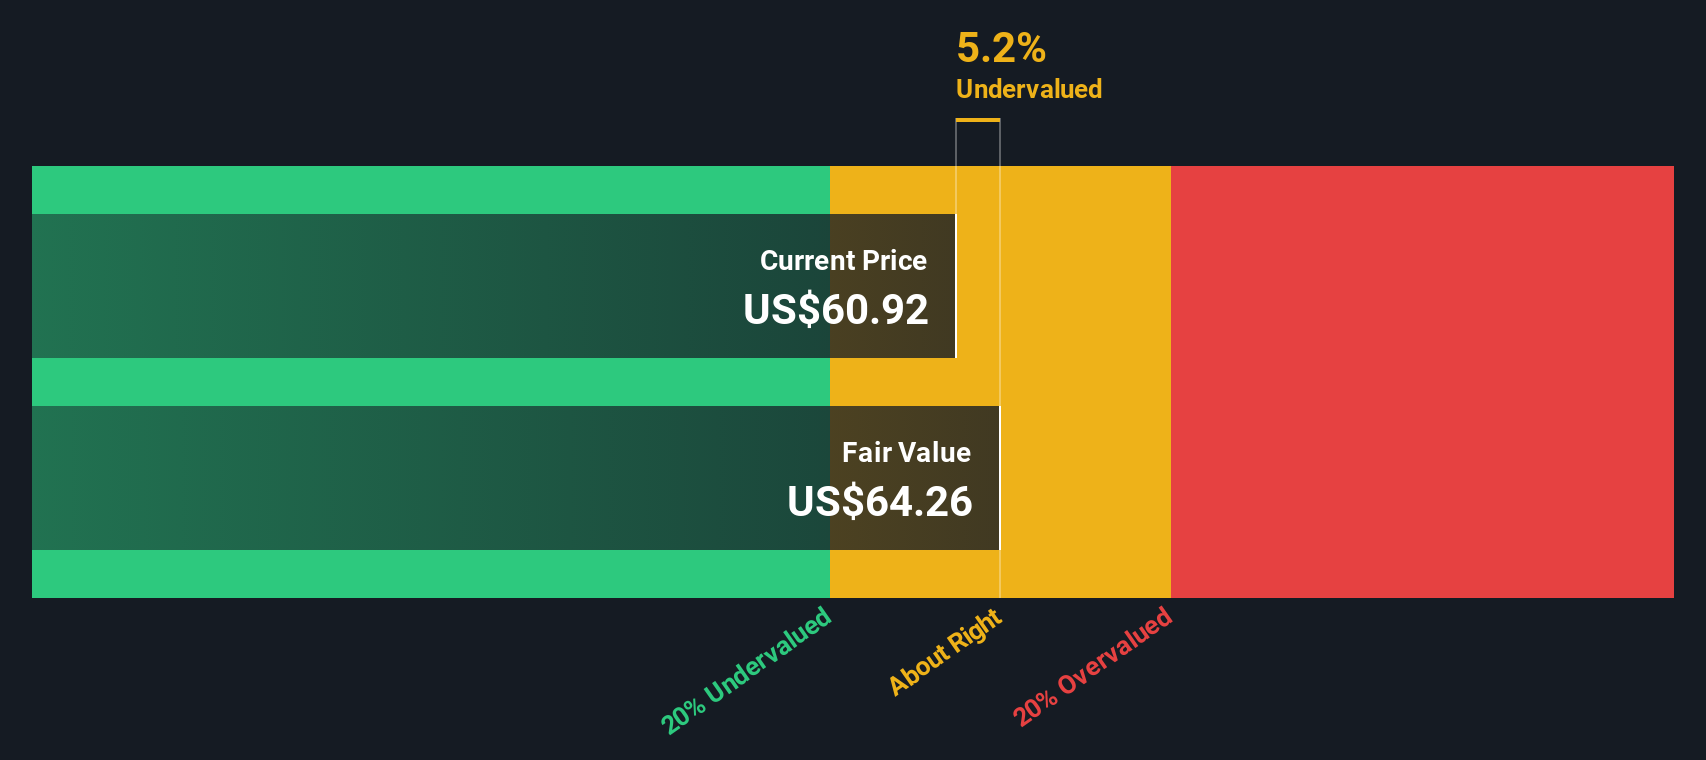
Approach 1: H.B. Fuller Discounted Cash Flow (DCF) Analysis
The Discounted Cash Flow (DCF) approach estimates a company's intrinsic value by projecting its expected future cash flows and then discounting those amounts back to their value today. This gives investors an idea of what the business is really worth, independent of recent share price movements or market sentiment.
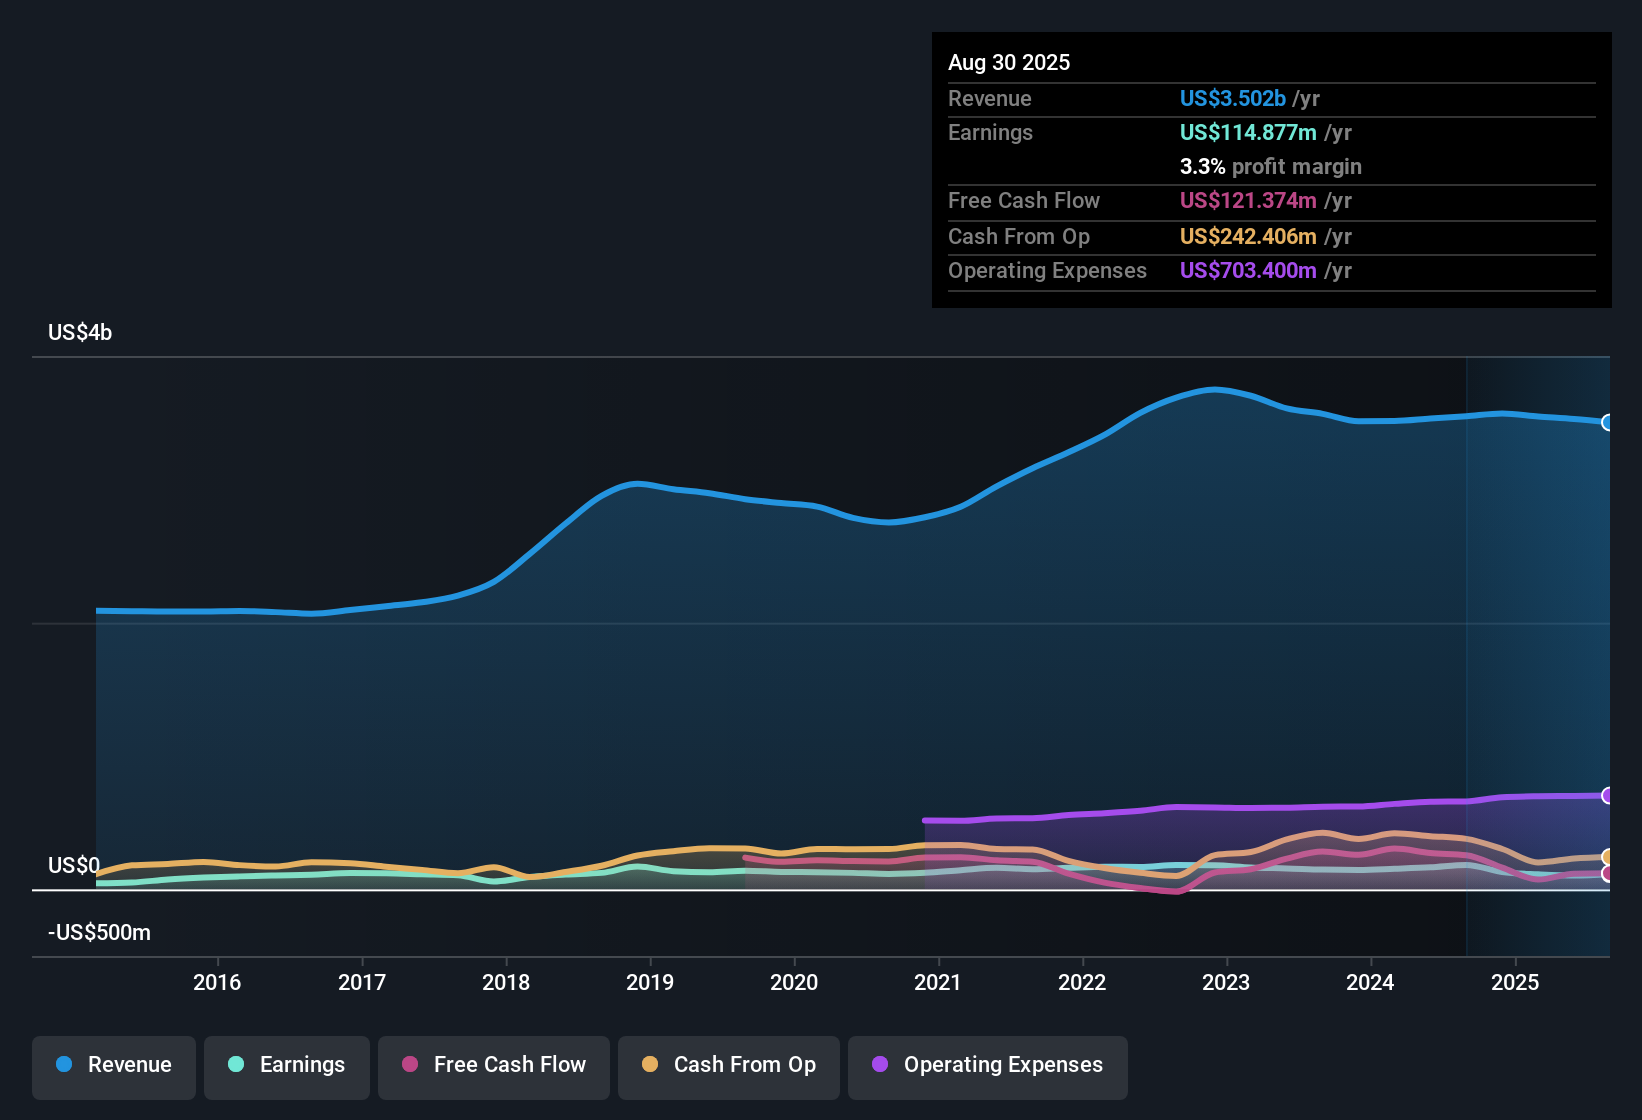
For H.B. Fuller, the current Free Cash Flow (FCF) stands at $115.5 million. Analysts provide precise FCF estimates for the next few years, after which further projections are extrapolated. According to available data, the company’s FCF is forecasted to grow steadily, reaching $246.5 million by 2035 based on long-term assumptions.
Bringing all these cash flows back to today's value, the DCF model points to an estimated fair value of $61.79 per share. Compared to the recent share price of $60.41, this suggests H.B. Fuller is trading at a modest 2.2% discount to its intrinsic value. That margin is slim, indicating the market price is hovering close to what the business is fundamentally worth.
Result: ABOUT RIGHT
Simply Wall St performs a valuation analysis on every stock in the world every day (check out H.B. Fuller's valuation analysis). We show the entire calculation in full. You can track the result in your watchlist or portfolio and be alerted when this changes.
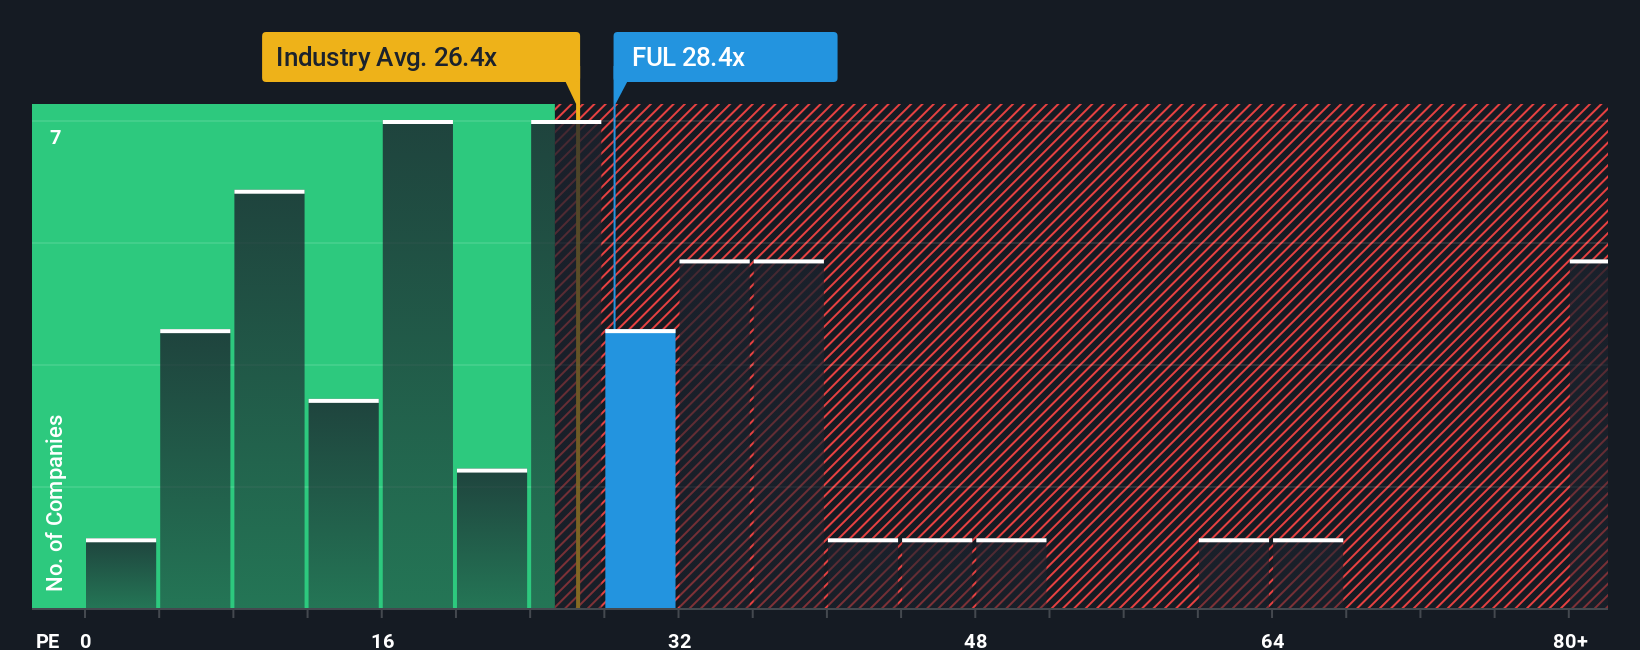
Approach 2: H.B. Fuller Price vs Earnings
The price-to-earnings (PE) ratio remains one of the go-to valuation tools for profitable companies like H.B. Fuller because it connects the stock price directly to underlying earnings. A suitable PE ratio accounts not just for current profitability, but also market expectations around future growth and risk. Companies with higher anticipated growth or greater stability tend to command higher PE ratios, while those facing uncertainty or minimal growth are priced more cautiously by investors.
H.B. Fuller currently trades at a PE ratio of 28.4x. To put this in perspective, the average PE for the broader chemicals industry is 26.4x, while peer companies have a higher average of 46.9x. On a surface level, this might suggest H.B. Fuller is modestly more expensive than most of its industry, but cheaper than direct peers with loftier valuations.
This is where Simply Wall St’s proprietary “Fair Ratio” comes in. The Fair Ratio for H.B. Fuller is calculated at 23.4x, taking into account not just industry averages, but the company’s actual growth outlook, profit margins, risk profile, and overall market cap. This tailored metric gives a clearer sense of value than a peer or sector comparison by focusing on fundamentals that directly impact future returns.
With the current PE (28.4x) sitting a little above the Fair Ratio (23.4x), the stock trades at a premium to what a fair valuation would suggest. Since this difference is greater than the 0.10 margin, H.B. Fuller looks slightly overvalued when viewed through this lens.
Result: OVERVALUED
PE ratios tell one story, but what if the real opportunity lies elsewhere? Discover companies where insiders are betting big on explosive growth.
Upgrade Your Decision Making: Choose your H.B. Fuller Narrative
Earlier we mentioned there is an even better way to understand valuation, so let's introduce you to Narratives. Narratives are your opportunity to bring your own investing perspective to life. This means turning the story you see for H.B. Fuller into a financial forecast, estimating future revenue, earnings, and margins, which then translates into your version of fair value for the stock.
On Simply Wall St’s Community page, millions of investors use Narratives as an easy, accessible tool to clarify how the latest news, company actions, or changing industry conditions might shift their expectations of a company’s future. Narratives link together what’s happening in the real world, your outlook, and a quantified fair value, helping you decide if H.B. Fuller’s current price is a buy, hold, or sell for your story.
Because Narratives update automatically with each earnings report or major headline, your view on fair value remains relevant and you can react quickly and confidently. For example, one Narrative could closely track the bullish consensus with a price target of $75.0, expecting growth from strategic initiatives, while the most cautious Narrative pins fair value as low as $54.0, reflecting concerns about weak market demand and profitability.
Do you think there's more to the story for H.B. Fuller? Create your own Narrative to let the Community know!
This article by Simply Wall St is general in nature. We provide commentary based on historical data and analyst forecasts only using an unbiased methodology and our articles are not intended to be financial advice. It does not constitute a recommendation to buy or sell any stock, and does not take account of your objectives, or your financial situation. We aim to bring you long-term focused analysis driven by fundamental data. Note that our analysis may not factor in the latest price-sensitive company announcements or qualitative material. Simply Wall St has no position in any stocks mentioned.
Valuation is complex, but we're here to simplify it.
Discover if H.B. Fuller might be undervalued or overvalued with our detailed analysis, featuring fair value estimates, potential risks, dividends, insider trades, and its financial condition.
Access Free AnalysisHave feedback on this article? Concerned about the content? Get in touch with us directly. Alternatively, email editorial-team@simplywallst.com
About NYSE:FUL
H.B. Fuller
H.B. Fuller Company, together with its subsidiaries, formulates, manufactures, and markets adhesives, sealants, coatings, polymers, tapes, encapsulants, additives, and other specialty chemical products.
Established dividend payer with moderate growth potential.
Similar Companies
Market Insights

Advertisement
Community Narratives
A formidable player in AI and enterprise computing.
Fair Value US$210.00|12.2% overvalued
CO
Community Contributor
IREN's Bold Moves in Sustainable Bitcoin Mining & AI Data Centers
Fair Value US$72.52|17.1% undervalued
BL
Community Contributor
Cooling the Champions: The Aussie Tech Behind F1's Victories
Fair Value AU$12.40|38.7% undervalued
TR
Community Contributor