
Advertisement
- United States
- /
- Metals and Mining
- /
- NYSE:CMP
Is Compass Minerals International (NYSE:CMP) A Risky Investment?
David Iben put it well when he said, 'Volatility is not a risk we care about. What we care about is avoiding the permanent loss of capital.' It's only natural to consider a company's balance sheet when you examine how risky it is, since debt is often involved when a business collapses. We can see that Compass Minerals International, Inc. (NYSE:CMP) does use debt in its business. But the real question is whether this debt is making the company risky.
When Is Debt Dangerous?
Debt is a tool to help businesses grow, but if a business is incapable of paying off its lenders, then it exists at their mercy. If things get really bad, the lenders can take control of the business. However, a more usual (but still expensive) situation is where a company must dilute shareholders at a cheap share price simply to get debt under control. Of course, debt can be an important tool in businesses, particularly capital heavy businesses. When we think about a company's use of debt, we first look at cash and debt together.
View our latest analysis for Compass Minerals International
What Is Compass Minerals International's Debt?
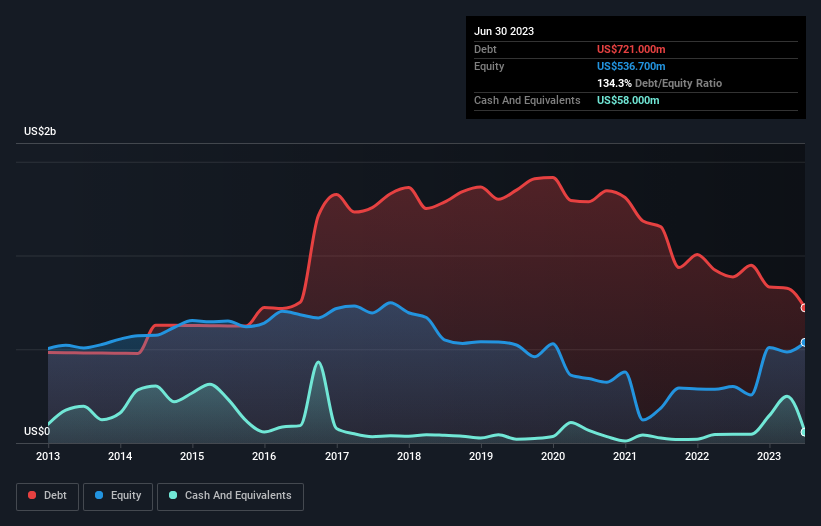
You can click the graphic below for the historical numbers, but it shows that Compass Minerals International had US$721.0m of debt in June 2023, down from US$885.9m, one year before. However, because it has a cash reserve of US$58.0m, its net debt is less, at about US$663.0m.
How Strong Is Compass Minerals International's Balance Sheet?
According to the last reported balance sheet, Compass Minerals International had liabilities of US$246.0m due within 12 months, and liabilities of US$949.9m due beyond 12 months. On the other hand, it had cash of US$58.0m and US$95.8m worth of receivables due within a year. So its liabilities outweigh the sum of its cash and (near-term) receivables by US$1.04b.
When you consider that this deficiency exceeds the company's US$1.00b market capitalization, you might well be inclined to review the balance sheet intently. In the scenario where the company had to clean up its balance sheet quickly, it seems likely shareholders would suffer extensive dilution.
In order to size up a company's debt relative to its earnings, we calculate its net debt divided by its earnings before interest, tax, depreciation, and amortization (EBITDA) and its earnings before interest and tax (EBIT) divided by its interest expense (its interest cover). The advantage of this approach is that we take into account both the absolute quantum of debt (with net debt to EBITDA) and the actual interest expenses associated with that debt (with its interest cover ratio).
While Compass Minerals International's debt to EBITDA ratio (3.5) suggests that it uses some debt, its interest cover is very weak, at 1.7, suggesting high leverage. In large part that's due to the company's significant depreciation and amortisation charges, which arguably mean its EBITDA is a very generous measure of earnings, and its debt may be more of a burden than it first appears. So shareholders should probably be aware that interest expenses appear to have really impacted the business lately. The silver lining is that Compass Minerals International grew its EBIT by 101% last year, which nourishing like the idealism of youth. If that earnings trend continues it will make its debt load much more manageable in the future. When analysing debt levels, the balance sheet is the obvious place to start. But it is future earnings, more than anything, that will determine Compass Minerals International's ability to maintain a healthy balance sheet going forward. So if you're focused on the future you can check out this free report showing analyst profit forecasts.
Finally, while the tax-man may adore accounting profits, lenders only accept cold hard cash. So we clearly need to look at whether that EBIT is leading to corresponding free cash flow. Over the last three years, Compass Minerals International reported free cash flow worth 20% of its EBIT, which is really quite low. That limp level of cash conversion undermines its ability to manage and pay down debt.
Our View
We'd go so far as to say Compass Minerals International's interest cover was disappointing. But at least it's pretty decent at growing its EBIT; that's encouraging. Looking at the balance sheet and taking into account all these factors, we do believe that debt is making Compass Minerals International stock a bit risky. Some people like that sort of risk, but we're mindful of the potential pitfalls, so we'd probably prefer it carry less debt. The balance sheet is clearly the area to focus on when you are analysing debt. However, not all investment risk resides within the balance sheet - far from it. We've identified 3 warning signs with Compass Minerals International (at least 2 which are a bit unpleasant) , and understanding them should be part of your investment process.
If you're interested in investing in businesses that can grow profits without the burden of debt, then check out this free list of growing businesses that have net cash on the balance sheet.
New: AI Stock Screener & Alerts
Our new AI Stock Screener scans the market every day to uncover opportunities.
• Dividend Powerhouses (3%+ Yield)
• Undervalued Small Caps with Insider Buying
• High growth Tech and AI Companies
Or build your own from over 50 metrics.
Have feedback on this article? Concerned about the content? Get in touch with us directly. Alternatively, email editorial-team (at) simplywallst.com.
This article by Simply Wall St is general in nature. We provide commentary based on historical data and analyst forecasts only using an unbiased methodology and our articles are not intended to be financial advice. It does not constitute a recommendation to buy or sell any stock, and does not take account of your objectives, or your financial situation. We aim to bring you long-term focused analysis driven by fundamental data. Note that our analysis may not factor in the latest price-sensitive company announcements or qualitative material. Simply Wall St has no position in any stocks mentioned.
About NYSE:CMP
Compass Minerals International
Provides essential minerals in the United States, Canada, the United Kingdom, and internationally.
Moderate growth potential with mediocre balance sheet.
Similar Companies
Market Insights

Advertisement
Community Narratives
MicroVision will explode future revenue by 380.37% with a vision towards success
Fair Value US$60.00|98.4% undervalued
TH
Community Contributor
The Indispensable Artery for a New North American Economy
Fair Value CA$132.87|3.6% undervalued
TI
Community Contributor