
Advertisement
- United States
- /
- Metals and Mining
- /
- NYSE:CMP
Compass Minerals International (NYSE:CMP) May Have Issues Allocating Its Capital
What underlying fundamental trends can indicate that a company might be in decline? A business that's potentially in decline often shows two trends, a return on capital employed (ROCE) that's declining, and a base of capital employed that's also declining. This indicates to us that the business is not only shrinking the size of its net assets, but its returns are falling as well. So after glancing at the trends within Compass Minerals International (NYSE:CMP), we weren't too hopeful.
Return On Capital Employed (ROCE): What Is It?
Just to clarify if you're unsure, ROCE is a metric for evaluating how much pre-tax income (in percentage terms) a company earns on the capital invested in its business. The formula for this calculation on Compass Minerals International is:
Return on Capital Employed = Earnings Before Interest and Tax (EBIT) ÷ (Total Assets - Current Liabilities)
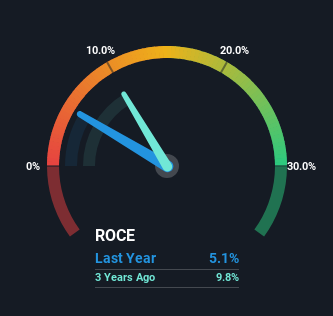
0.051 = US$79m ÷ (US$1.8b - US$276m) (Based on the trailing twelve months to September 2023).
Thus, Compass Minerals International has an ROCE of 5.1%. Ultimately, that's a low return and it under-performs the Metals and Mining industry average of 9.7%.
Check out our latest analysis for Compass Minerals International
In the above chart we have measured Compass Minerals International's prior ROCE against its prior performance, but the future is arguably more important. If you'd like, you can check out the forecasts from the analysts covering Compass Minerals International here for free.
What Does the ROCE Trend For Compass Minerals International Tell Us?
We aren't too thrilled by the trend because ROCE has declined 26% over the last five years and despite the capital raising conducted before the latest reports, the business has -27% less capital employed.
The Key Takeaway
In summary, it's unfortunate that Compass Minerals International is shrinking its capital base and also generating lower returns. Investors haven't taken kindly to these developments, since the stock has declined 52% from where it was five years ago. With underlying trends that aren't great in these areas, we'd consider looking elsewhere.
Compass Minerals International does come with some risks though, we found 3 warning signs in our investment analysis, and 2 of those are a bit concerning...
If you want to search for solid companies with great earnings, check out this free list of companies with good balance sheets and impressive returns on equity.
New: AI Stock Screener & Alerts
Our new AI Stock Screener scans the market every day to uncover opportunities.
• Dividend Powerhouses (3%+ Yield)
• Undervalued Small Caps with Insider Buying
• High growth Tech and AI Companies
Or build your own from over 50 metrics.
Have feedback on this article? Concerned about the content? Get in touch with us directly. Alternatively, email editorial-team (at) simplywallst.com.
This article by Simply Wall St is general in nature. We provide commentary based on historical data and analyst forecasts only using an unbiased methodology and our articles are not intended to be financial advice. It does not constitute a recommendation to buy or sell any stock, and does not take account of your objectives, or your financial situation. We aim to bring you long-term focused analysis driven by fundamental data. Note that our analysis may not factor in the latest price-sensitive company announcements or qualitative material. Simply Wall St has no position in any stocks mentioned.
About NYSE:CMP
Compass Minerals International
Provides essential minerals in the United States, Canada, the United Kingdom, and internationally.
Moderate growth potential with mediocre balance sheet.
Similar Companies
Market Insights

Advertisement
Community Narratives
MicroVision will explode future revenue by 380.37% with a vision towards success
Fair Value US$60.00|98.5% undervalued
TH
Community Contributor
The Indispensable Artery for a New North American Economy
Fair Value CA$132.87|2.3% undervalued
TI
Community Contributor