
Advertisement
- United States
- /
- Paper and Forestry Products
- /
- NYSE:CLW
With A 26% Price Drop For Clearwater Paper Corporation (NYSE:CLW) You'll Still Get What You Pay For
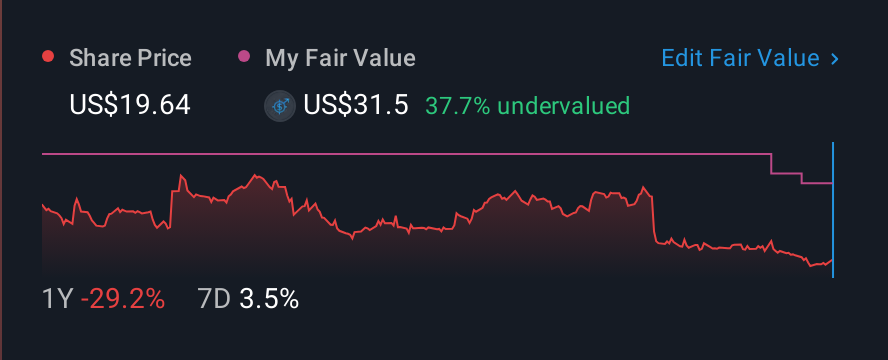
The Clearwater Paper Corporation (NYSE:CLW) share price has fared very poorly over the last month, falling by a substantial 26%. Instead of being rewarded, shareholders who have already held through the last twelve months are now sitting on a 35% share price drop.
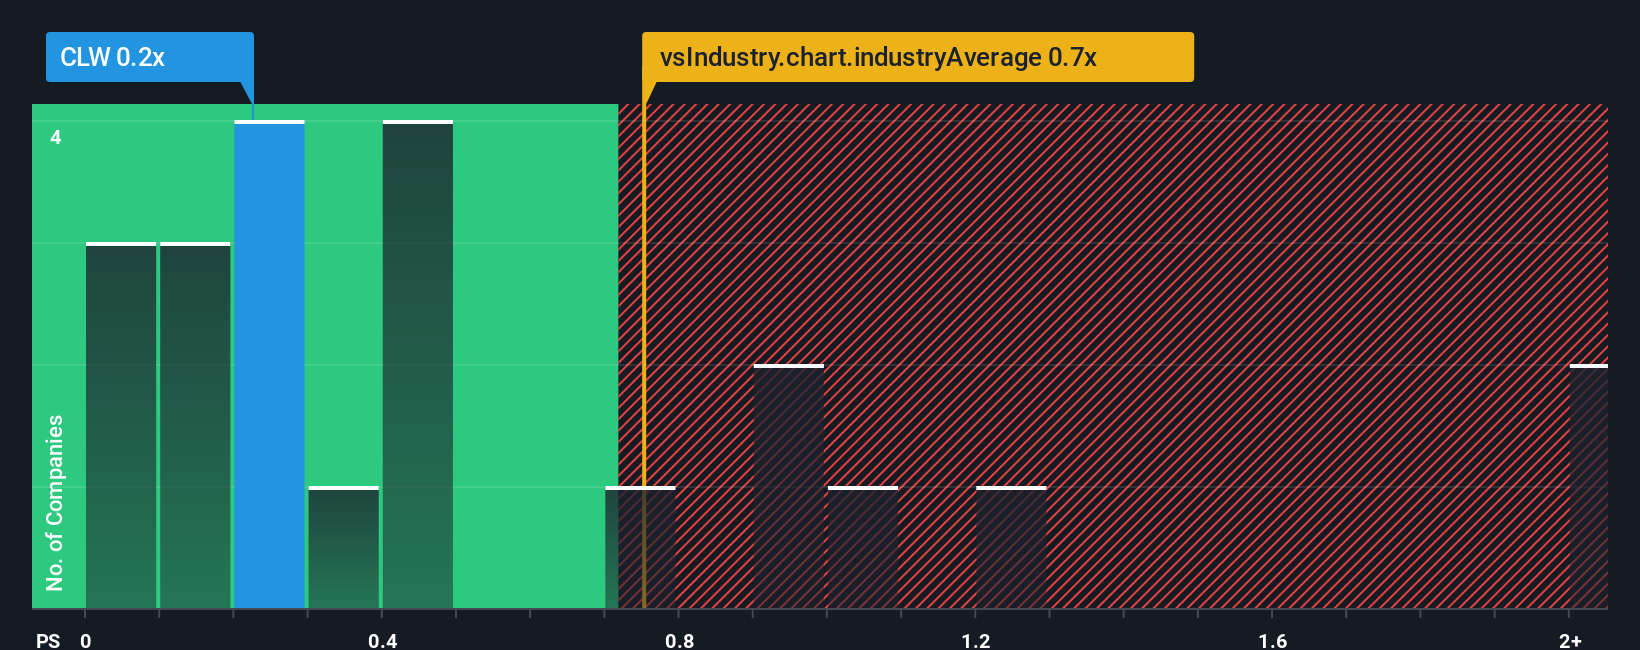
Although its price has dipped substantially, there still wouldn't be many who think Clearwater Paper's price-to-sales (or "P/S") ratio of 0.2x is worth a mention when it essentially matches the median P/S in the United States' Forestry industry. However, investors might be overlooking a clear opportunity or potential setback if there is no rational basis for the P/S.
View our latest analysis for Clearwater Paper
How Clearwater Paper Has Been Performing
Clearwater Paper certainly has been doing a good job lately as it's been growing revenue more than most other companies. It might be that many expect the strong revenue performance to wane, which has kept the P/S ratio from rising. If the company manages to stay the course, then investors should be rewarded with a share price that matches its revenue figures.
If you'd like to see what analysts are forecasting going forward, you should check out our free report on Clearwater Paper.What Are Revenue Growth Metrics Telling Us About The P/S?
There's an inherent assumption that a company should be matching the industry for P/S ratios like Clearwater Paper's to be considered reasonable.
If we review the last year of revenue growth, the company posted a terrific increase of 35%. However, this wasn't enough as the latest three year period has seen the company endure a nasty 21% drop in revenue in aggregate. Therefore, it's fair to say the revenue growth recently has been undesirable for the company.
Turning to the outlook, the next year should generate growth of 0.4% as estimated by the only analyst watching the company. Meanwhile, the rest of the industry is forecast to expand by 0.5%, which is not materially different.
With this information, we can see why Clearwater Paper is trading at a fairly similar P/S to the industry. Apparently shareholders are comfortable to simply hold on while the company is keeping a low profile.
What Does Clearwater Paper's P/S Mean For Investors?
Following Clearwater Paper's share price tumble, its P/S is just clinging on to the industry median P/S. Generally, our preference is to limit the use of the price-to-sales ratio to establishing what the market thinks about the overall health of a company.
Our look at Clearwater Paper's revenue growth estimates show that its P/S is about what we expect, as both metrics follow closely with the industry averages. Right now shareholders are comfortable with the P/S as they are quite confident future revenue won't throw up any surprises. All things considered, if the P/S and revenue estimates contain no major shocks, then it's hard to see the share price moving strongly in either direction in the near future.
Having said that, be aware Clearwater Paper is showing 1 warning sign in our investment analysis, you should know about.
Of course, profitable companies with a history of great earnings growth are generally safer bets. So you may wish to see this free collection of other companies that have reasonable P/E ratios and have grown earnings strongly.
New: AI Stock Screener & Alerts
Our new AI Stock Screener scans the market every day to uncover opportunities.
• Dividend Powerhouses (3%+ Yield)
• Undervalued Small Caps with Insider Buying
• High growth Tech and AI Companies
Or build your own from over 50 metrics.
Have feedback on this article? Concerned about the content? Get in touch with us directly. Alternatively, email editorial-team (at) simplywallst.com.
This article by Simply Wall St is general in nature. We provide commentary based on historical data and analyst forecasts only using an unbiased methodology and our articles are not intended to be financial advice. It does not constitute a recommendation to buy or sell any stock, and does not take account of your objectives, or your financial situation. We aim to bring you long-term focused analysis driven by fundamental data. Note that our analysis may not factor in the latest price-sensitive company announcements or qualitative material. Simply Wall St has no position in any stocks mentioned.
About NYSE:CLW
Clearwater Paper
Manufactures and supplies bleached paperboards in the United States and internationally.
Good value with mediocre balance sheet.
Similar Companies
Market Insights

Advertisement
Community Narratives
Finding The True Value Of A Logistics Powerhouse
Fair Value US$95.21|8.7% undervalued
NV
Community Contributor
Paradigm Biopharmaceuticals Will Lead Osteoarthritis Treatment with Zilosul's FDA Success
Fair Value AU$5.50|93.3% undervalued
AM
Community Contributor
Barrick Mining (ABX:CA): A Gold Hedge against a U.S. Shutdown
Fair Value CA$60.00|18.7% undervalued
GM
Community Contributor