Advertisement
- United States
- /
- Packaging
- /
- NYSE:AMCR
Assessing Amcor’s Appeal After Shares Climb 2.8% This Week

Simply Wall St
Reviewed by Bailey Pemberton
If Amcor stock has made it onto your radar, you are not alone. Plenty of investors have recently found themselves wondering if now is the right moment to buy, hold, or steer clear. After all, Amcor’s shares have had quite a ride so far this year. In just the past week, the stock has climbed 2.8%, offering some hope that sentiment might be turning. But when you zoom out, the story gets a little more complex: over the past month, Amcor slipped 1.6%, and year to date, shares are still down 12.8%. If you take the long view, there is even more ground to make up, with the stock falling 23.5% in the last year and roughly 16% in the past three years.
What is behind this shifting performance? Much of the recent action reflects broader market swings and shifting risk perceptions among global packaging companies, rather than anything company-specific shaping Amcor’s outlook. The market is still digesting changing demand trends and industry developments, and investors seem to be recalibrating how much risk they are willing to take in this sector.
So, where does Amcor stand right now on valuation? By one common scoring system, which checks six key measures of undervaluation, the company comes in with a score of 2 out of 6. This suggests undervaluation in a few areas, but not across the board. Still, headline numbers only tell part of the story. Let’s break down the major valuation approaches that analysts lean on, and stick around, because at the end I will share an even more insightful way to gauge whether Amcor offers real value.
Amcor scores just 2/6 on our valuation checks. See what other red flags we found in the full valuation breakdown.
Approach 1: Amcor Discounted Cash Flow (DCF) Analysis
The Discounted Cash Flow (DCF) model is one of the most widely used valuation tools among financial analysts. It works by projecting a company’s future cash flows and then discounting them back to today’s value, aiming to estimate what the business is truly worth based on its ability to generate cash over time.
For Amcor, the DCF analysis uses the 2 Stage Free Cash Flow to Equity model. Currently, Amcor’s last twelve months of Free Cash Flow (FCF) total $836.6 million. Analysts project FCF growth over the coming years, with estimates reaching $1.09 billion by 2029. These forecasts suggest a multi-year ramp-up before cash flow growth levels off. Since direct analyst projections only extend out five years, the later figures are derived using trend-based extrapolation methods.
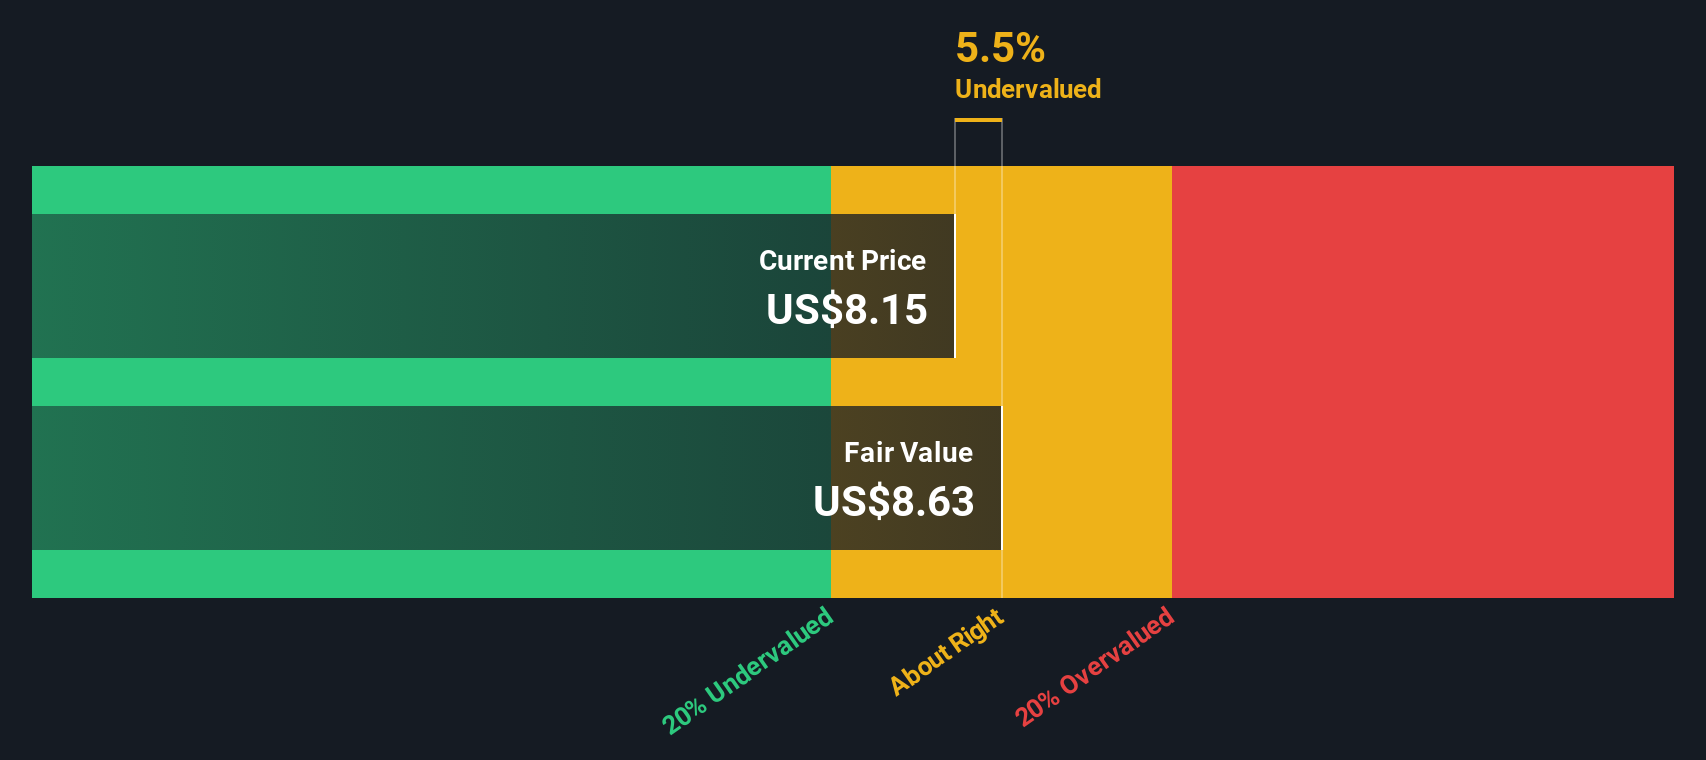
Based on these cash flow estimates, the DCF model arrives at an intrinsic fair value for Amcor of $8.63 per share. This represents a 5.5% discount compared to the current stock price. This implies that the shares are trading close to their estimated fair value, with just a slight edge toward being undervalued.
Result: ABOUT RIGHT
Simply Wall St performs a valuation analysis on every stock in the world every day (check out Amcor's valuation analysis). We show the entire calculation in full. You can track the result in your watchlist or portfolio and be alerted when this changes.
Approach 2: Amcor Price vs Earnings (PE) Ratio
For profitable, established companies like Amcor, the Price-to-Earnings (PE) ratio is one of the most commonly used valuation tools. This ratio helps investors understand how much they are paying for each dollar of a company's earnings. It is a cornerstone for comparing valuations across similar businesses.
Not all PE ratios are created equal, though. A higher PE can be justified if investors expect faster future earnings growth. Elevated risks or lower growth prospects typically warrant a lower PE ratio. It is important to judge Amcor’s multiple in the context of growth, risk, and the industry landscape.
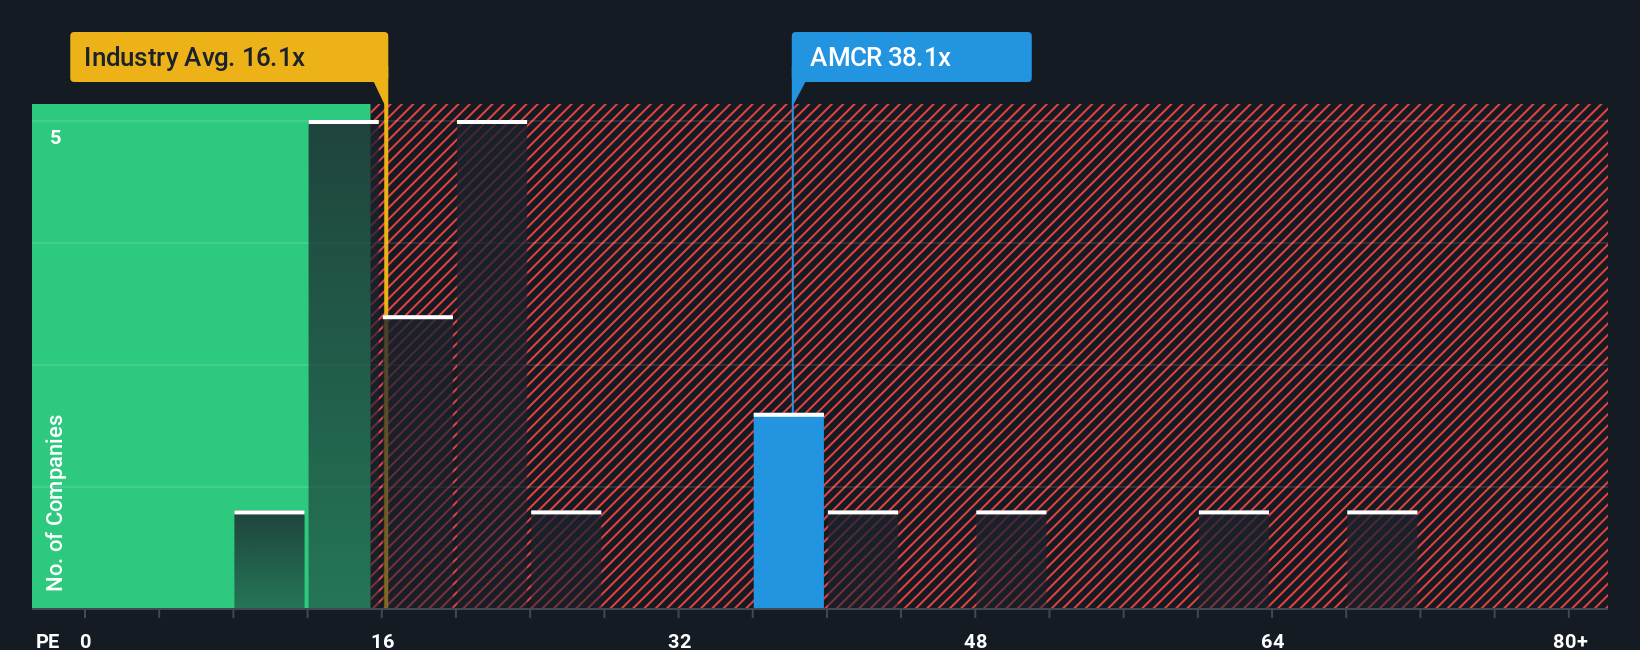
Right now, Amcor is trading at 36.9x earnings. That is significantly above the Packaging industry average of 16.1x and higher than the peer group average of 27.1x. However, these benchmarks only scratch the surface.
This is where Simply Wall St’s “Fair Ratio” metric comes in. The Fair Ratio goes a step further than simple peer or industry comparisons. It is tailored to the company, weighing expected growth, market cap, profit margins, and company-specific risk factors alongside industry characteristics. For Amcor, the Fair Ratio stands at 25.6x, which represents where a reasonable PE should land based on all available factors.
Comparing this Fair Ratio to Amcor’s current PE of 36.9x, the stock appears to be trading at a premium. This suggests the market is pricing in more optimism than fundamentals and risks may currently support.
Result: OVERVALUED
PE ratios tell one story, but what if the real opportunity lies elsewhere? Discover companies where insiders are betting big on explosive growth.
Upgrade Your Decision Making: Choose your Amcor Narrative
Earlier we mentioned that there is an even better way to understand valuation, so let's introduce you to Narratives. A Narrative is simply the story you create about a company based on your own view of its future, combining your expectations for revenue, earnings, margins, and other drivers to arrive at what you believe is a fair value. This approach links your perspective on what will drive the business to a clear financial forecast and then to a calculated fair value, all in one place.
Narratives make valuation accessible and actionable for everyone, not just experienced analysts, with user-friendly tools available in the Community page of Simply Wall St, trusted by millions of investors worldwide. By building your own Narrative, you can see instantly if Amcor is undervalued or overvalued for your assumptions by comparing your Fair Value to the share price, helping you decide whether to buy, hold, or sell with more confidence.
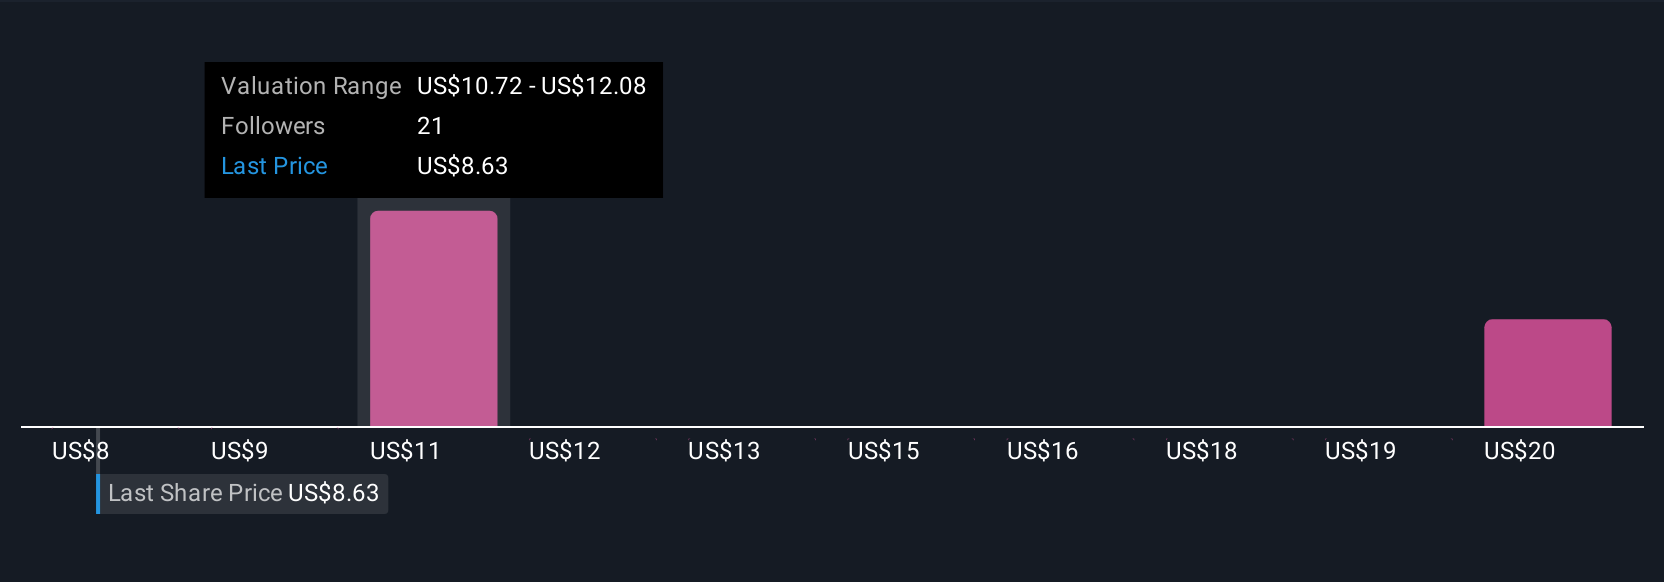
Narratives also update dynamically when new news or earnings data is released, keeping your investment view current as circumstances change. For example, one investor may believe in rapid growth and margin expansion from Amcor’s eco-friendly portfolio, estimating a Fair Value of $10.91, while another, focused on portfolio uncertainty and high leverage, may set their Fair Value as low as $8.19. This proves there is always more than one valid perspective behind the numbers.
Do you think there's more to the story for Amcor? Create your own Narrative to let the Community know!
This article by Simply Wall St is general in nature. We provide commentary based on historical data and analyst forecasts only using an unbiased methodology and our articles are not intended to be financial advice. It does not constitute a recommendation to buy or sell any stock, and does not take account of your objectives, or your financial situation. We aim to bring you long-term focused analysis driven by fundamental data. Note that our analysis may not factor in the latest price-sensitive company announcements or qualitative material. Simply Wall St has no position in any stocks mentioned.
New: Manage All Your Stock Portfolios in One Place
We've created the ultimate portfolio companion for stock investors, and it's free.
• Connect an unlimited number of Portfolios and see your total in one currency
• Be alerted to new Warning Signs or Risks via email or mobile
• Track the Fair Value of your stocks
Have feedback on this article? Concerned about the content? Get in touch with us directly. Alternatively, email editorial-team@simplywallst.com
About NYSE:AMCR
Amcor
Engages in the production and sale of packaging products in Europe, North America, Latin America, and the Asia Pacific.
Moderate risk with moderate growth potential.
Similar Companies
Market Insights

Advertisement
Community Narratives
Kodiak AI - a potential 100 bagger opportunity?
Fair Value US$14.00|44.7% undervalued
DA
Community Contributor
A Fair Price for a Great Business Facing Real Threats
Fair Value US$383.06|13.0% undervalued
IM
Community Contributor
AXON And Shopify Integration Will Unlock Global Mobile Advertising
Fair Value US$646.30|0% overvalued
AN
Based on Analyst Price Targets