
Advertisement
- United States
- /
- Packaging
- /
- NYSE:AMCR
Amcor (NYSE:AMCR) shareholders have endured a 6.6% loss from investing in the stock three years ago

For many investors, the main point of stock picking is to generate higher returns than the overall market. But in any portfolio, there are likely to be some stocks that fall short of that benchmark. We regret to report that long term Amcor plc (NYSE:AMCR) shareholders have had that experience, with the share price dropping 19% in three years, versus a market return of about 40%. The falls have accelerated recently, with the share price down 11% in the last three months.
Since shareholders are down over the longer term, lets look at the underlying fundamentals over the that time and see if they've been consistent with returns.
Check out our latest analysis for Amcor
To paraphrase Benjamin Graham: Over the short term the market is a voting machine, but over the long term it's a weighing machine. One flawed but reasonable way to assess how sentiment around a company has changed is to compare the earnings per share (EPS) with the share price.
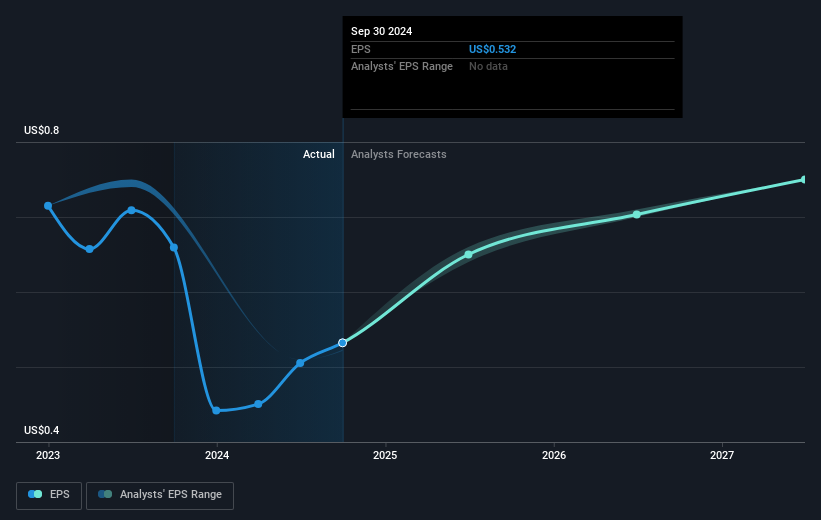
During the three years that the share price fell, Amcor's earnings per share (EPS) dropped by 4.5% each year. The share price decline of 7% is actually steeper than the EPS slippage. So it's likely that the EPS decline has disappointed the market, leaving investors hesitant to buy.
The company's earnings per share (over time) is depicted in the image below (click to see the exact numbers).
It's probably worth noting that the CEO is paid less than the median at similar sized companies. But while CEO remuneration is always worth checking, the really important question is whether the company can grow earnings going forward. It might be well worthwhile taking a look at our free report on Amcor's earnings, revenue and cash flow.
What About Dividends?
As well as measuring the share price return, investors should also consider the total shareholder return (TSR). The TSR is a return calculation that accounts for the value of cash dividends (assuming that any dividend received was reinvested) and the calculated value of any discounted capital raisings and spin-offs. It's fair to say that the TSR gives a more complete picture for stocks that pay a dividend. We note that for Amcor the TSR over the last 3 years was -6.6%, which is better than the share price return mentioned above. This is largely a result of its dividend payments!
A Different Perspective
Amcor shareholders are up 7.1% for the year (even including dividends). But that was short of the market average. On the bright side, that's still a gain, and it's actually better than the average return of 3% over half a decade This suggests the company might be improving over time. I find it very interesting to look at share price over the long term as a proxy for business performance. But to truly gain insight, we need to consider other information, too. For example, we've discovered 2 warning signs for Amcor that you should be aware of before investing here.
If you like to buy stocks alongside management, then you might just love this free list of companies. (Hint: many of them are unnoticed AND have attractive valuation).
Please note, the market returns quoted in this article reflect the market weighted average returns of stocks that currently trade on American exchanges.
New: Manage All Your Stock Portfolios in One Place
We've created the ultimate portfolio companion for stock investors, and it's free.
• Connect an unlimited number of Portfolios and see your total in one currency
• Be alerted to new Warning Signs or Risks via email or mobile
• Track the Fair Value of your stocks
Have feedback on this article? Concerned about the content? Get in touch with us directly. Alternatively, email editorial-team (at) simplywallst.com.
This article by Simply Wall St is general in nature. We provide commentary based on historical data and analyst forecasts only using an unbiased methodology and our articles are not intended to be financial advice. It does not constitute a recommendation to buy or sell any stock, and does not take account of your objectives, or your financial situation. We aim to bring you long-term focused analysis driven by fundamental data. Note that our analysis may not factor in the latest price-sensitive company announcements or qualitative material. Simply Wall St has no position in any stocks mentioned.
About NYSE:AMCR
Amcor
Develops, produces, and sells packaging products in Europe, North America, Latin America, and the Asia Pacific.
Solid track record with reasonable growth potential.
Similar Companies
Market Insights


Advertisement
Community Narratives
The Future of Drug Testing? Fingerprint Tech Shows Serious Promise
Fair Value US$2.98|40.3% undervalued
JO
Community Contributor
Suncorp’s Next Chapter: Insurance-Only and Ready to Grow
Fair Value AU$22.83|8.8% undervalued
RO
Community Contributor
Thyssenkrupp Nucera Will Achieve Double-Digit Profits by 2030 Boosted by Hydrogen Growth
Fair Value €14.40|31.3% undervalued
CH
Community Contributor
Tesla’s Nvidia Moment – The AI & Robotics Inflection Point
Fair Value US$384.84|18.1% undervalued
BL
Community Contributor