Advertisement
- United States
- /
- Insurance
- /
- NYSE:WRB
Does Recent 5% Pullback in W. R. Berkley Signal a Better Entry Point for 2025?

Simply Wall St
Reviewed by Bailey Pemberton
If you’re eyeing W. R. Berkley and wondering whether now’s the right time to act, you’ve got plenty of company. It’s the kind of stock that draws attention after a big run, and this insurer’s journey has certainly kept long-term holders happy. Even with a somewhat bumpy road over the past week, down 5.0%, the stock’s longer-term performance remains impressive, up 27.0% year-to-date and nearly 179% over five years. That kind of growth does not come out of nowhere, hinting at both operational strength and changing investor sentiment. Some of these moves have tracked broad market developments, such as shifting risk appetites among institutional investors, which have especially benefited steady, well-capitalized insurers.
Of course, performance like this always prompts the big question: is W. R. Berkley still attractively valued, or has the rally pushed shares into pricey territory? Based on our in-depth valuation checks, the company scores a 2 out of 6 for undervaluation, suggesting that while there is value to be found, it is not a deep bargain across the board. Let’s break down what these valuation measures really mean, and later in the article, I’ll share an even better way to gauge whether the stock might be the right fit for your portfolio.
W. R. Berkley scores just 2/6 on our valuation checks. See what other red flags we found in the full valuation breakdown.
Approach 1: W. R. Berkley Excess Returns Analysis
The Excess Returns model focuses on how efficiently a company generates earnings from its equity, above and beyond the minimum required return for investors. In W. R. Berkley’s case, this model offers a clear snapshot of shareholder value creation, spotlighting both profitability and growth expectations.
For the latest period, W. R. Berkley has a Book Value of $24.50 per share and a stable EPS forecast of $5.25 per share, according to weighted future Return on Equity estimates from eight analysts. The company’s average Return on Equity stands at a robust 17.66%, showing strong earnings power. The estimated Cost of Equity is $2.02 per share, meaning the company is earning well above what investors would typically demand. The resulting Excess Return is $3.24 per share, with the stable Book Value expected to rise to $29.75 per share, again based on analyst consensus.
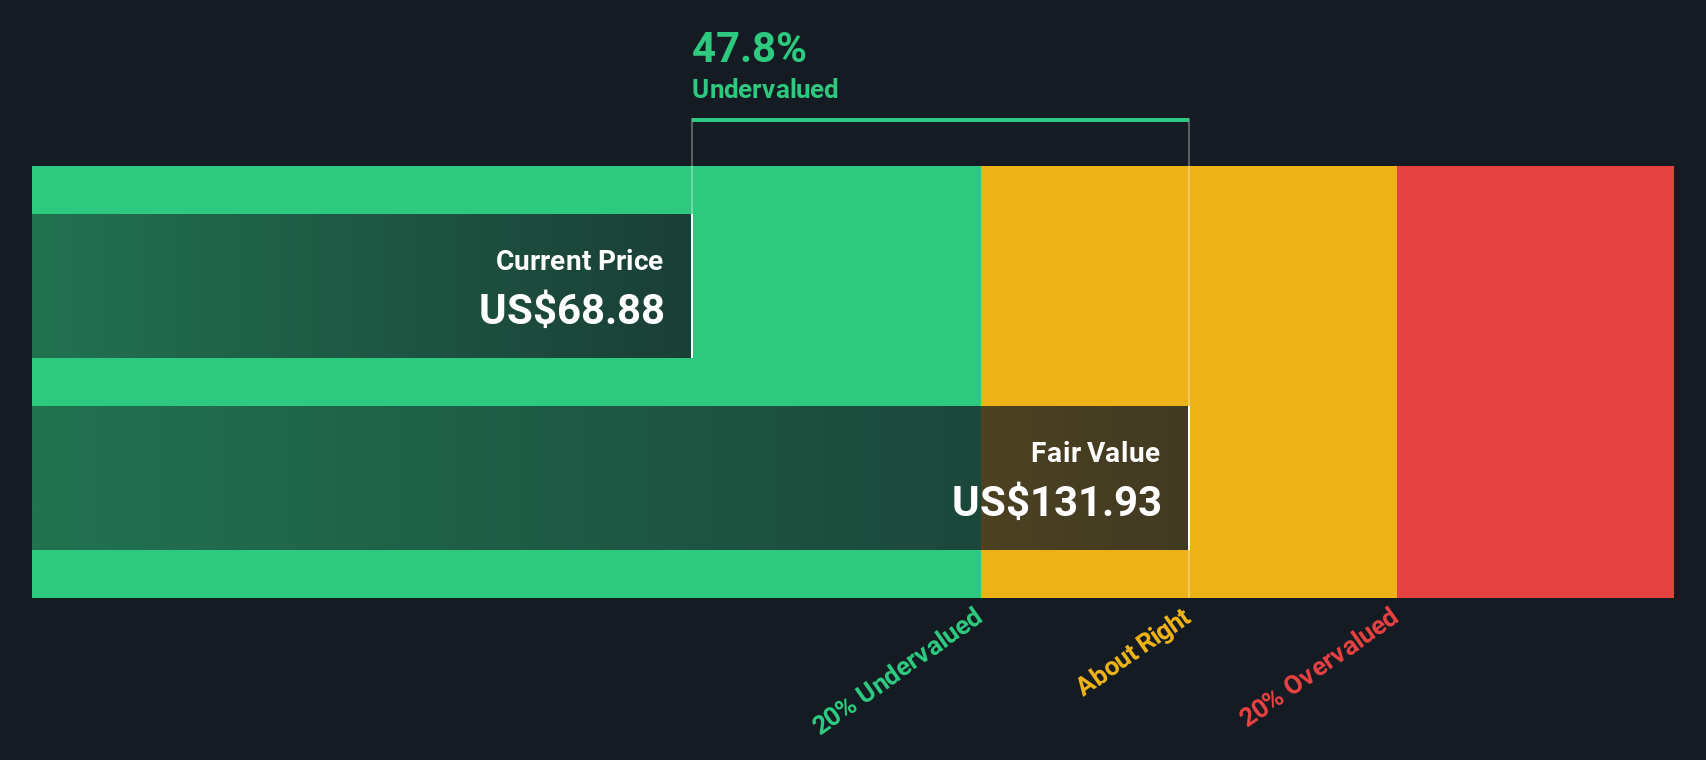
Based on these figures, the intrinsic value calculated by this approach indicates W. R. Berkley stock is 37.3% undervalued. This suggests that the market may be underrating the company’s ability to generate returns beyond its cost of capital and highlights real potential upside from current prices.
Result: UNDERVALUED
Our Excess Returns analysis suggests W. R. Berkley is undervalued by 37.3%. Track this in your watchlist or portfolio, or discover more undervalued stocks.
Approach 2: W. R. Berkley Price vs Earnings
The Price-to-Earnings (PE) ratio is a widely used valuation tool for profitable companies like W. R. Berkley because it offers a straightforward measure of what investors are willing to pay for a dollar of earnings. For established, consistently profitable insurers, the PE ratio is especially helpful, as it factors in both current profitability and anticipated future growth.
A “normal” or “fair” PE ratio varies depending on market expectations for earnings growth and perceived risks. Companies with higher expected growth or lower risk tend to command higher PE multiples, while those facing more uncertainty or slower growth usually trade at lower ratios.
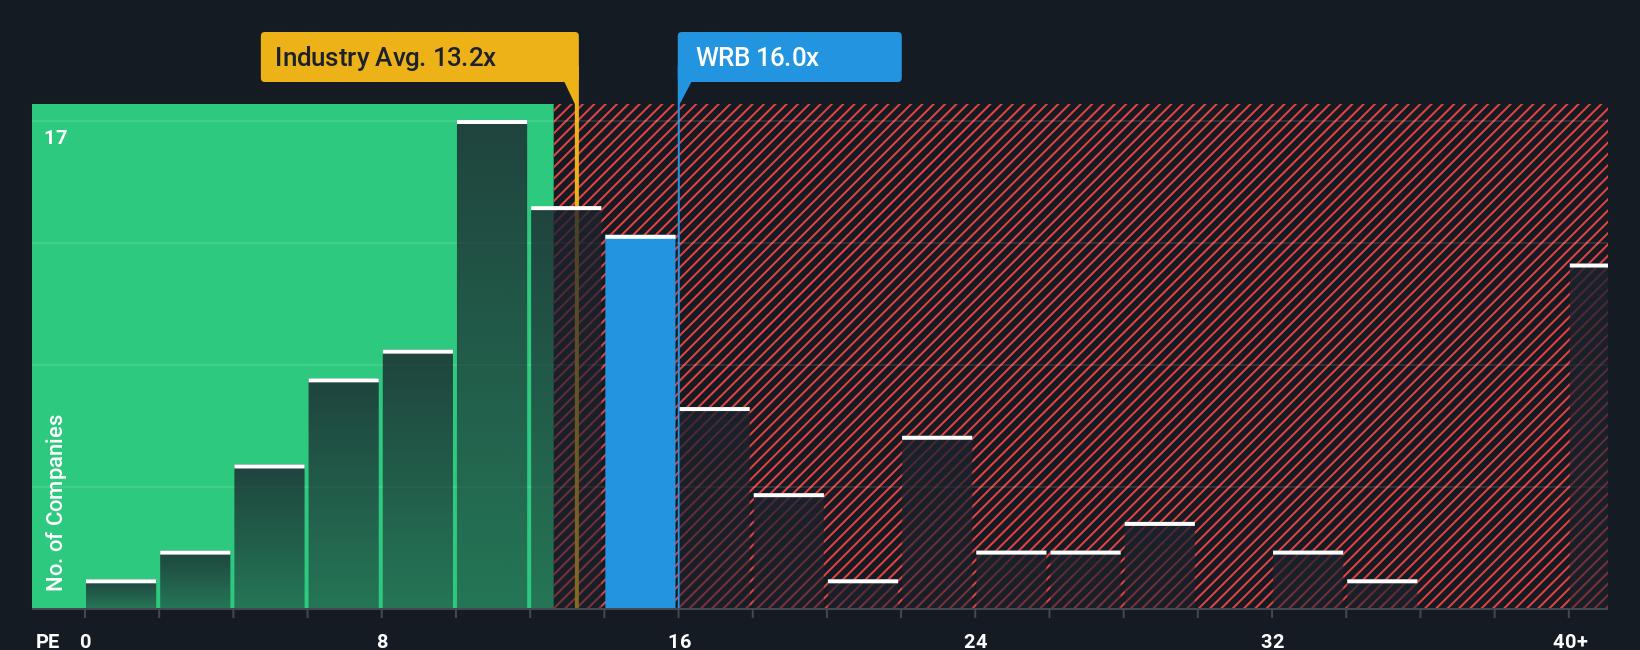
W. R. Berkley’s current PE ratio stands at 15.87x. Compared to the insurance industry average of 14.18x and its peer group average of 12.50x, the stock trades at a modest premium. However, these rough comparisons do not fully capture the whole story.
This is where the Simply Wall St Fair Ratio steps in. The Fair Ratio is calculated by factoring in the company’s growth outlook, risk level, profit margin, industry group, and market cap, providing a more accurate valuation anchor than just looking at peer or industry averages. For W. R. Berkley, the Fair Ratio is estimated at 13.32x, reflecting a balanced view of the company's strengths and risks in context.
Comparing the current PE of 15.87x with the Fair Ratio of 13.32x suggests the stock is trading above its fundamental fair value, pointing to some overvaluation at current levels.
Result: OVERVALUED
PE ratios tell one story, but what if the real opportunity lies elsewhere? Discover companies where insiders are betting big on explosive growth.
Upgrade Your Decision Making: Choose your W. R. Berkley Narrative
Earlier, we mentioned there is an even better way to understand valuation, so let’s introduce you to Narratives. A Narrative is your investment story, connecting your perspective on W. R. Berkley’s business (for example, profit margins, growth, industry shifts, or competitive strengths) directly to your own forecast for the company’s revenue, earnings, and future fair value.
Narratives bridge the gap between what you believe about the company’s future and how that translates financially. This makes it much easier to judge if W. R. Berkley is a buy, sell, or hold at today’s price. Through Simply Wall St's Community page, you can access and create Narratives, joining millions of investors who track their ideas, see how analyst and community expectations compare, and get notified as Narratives automatically update with new earnings or news.
For example, some investors might see W. R. Berkley’s agility and market focus as positioning it for higher margins and robust growth, leading to a bullish fair value of $86.00 per share. Others, more concerned about rising competition and earnings risks, could see the fair value closer to $56.00. Narratives make this transparent, allowing you to instantly compare your assumptions with both the current price and other investors’ outlooks.
Do you think there's more to the story for W. R. Berkley? Create your own Narrative to let the Community know!
This article by Simply Wall St is general in nature. We provide commentary based on historical data and analyst forecasts only using an unbiased methodology and our articles are not intended to be financial advice. It does not constitute a recommendation to buy or sell any stock, and does not take account of your objectives, or your financial situation. We aim to bring you long-term focused analysis driven by fundamental data. Note that our analysis may not factor in the latest price-sensitive company announcements or qualitative material. Simply Wall St has no position in any stocks mentioned.
Valuation is complex, but we're here to simplify it.
Discover if W. R. Berkley might be undervalued or overvalued with our detailed analysis, featuring fair value estimates, potential risks, dividends, insider trades, and its financial condition.
Access Free AnalysisHave feedback on this article? Concerned about the content? Get in touch with us directly. Alternatively, email editorial-team@simplywallst.com
About NYSE:WRB
W. R. Berkley
An insurance holding company, operates as a commercial line writer worldwide.
Excellent balance sheet with proven track record and pays a dividend.
Similar Companies
Market Insights

Advertisement
Community Narratives
Kodiak AI - a potential 100 bagger opportunity?
Fair Value US$14.00|41.9% undervalued
DA
Community Contributor
A Fair Price for a Great Business Facing Real Threats
Fair Value US$383.06|14.1% undervalued
IM
Community Contributor
AXON And Shopify Integration Will Unlock Global Mobile Advertising
Fair Value US$613.59|1.2% undervalued
AN
Based on Analyst Price Targets