- United States
- /
- Insurance
- /
- NYSE:THG
Investors in Hanover Insurance Group (NYSE:THG) have seen returns of 26% over the past year


It's always best to build a diverse portfolio of shares, since any stock business could lag the broader market. Of course, the aim of the game is to pick stocks that do better than an index fund. The Hanover Insurance Group, Inc. (NYSE:THG) has done well over the last year, with the stock price up 23% beating the market return of 22% (not including dividends). In contrast, the longer term returns are negative, since the share price is 4.9% lower than it was three years ago.
Let's take a look at the underlying fundamentals over the longer term, and see if they've been consistent with shareholders returns.
Check out our latest analysis for Hanover Insurance Group
There is no denying that markets are sometimes efficient, but prices do not always reflect underlying business performance. One way to examine how market sentiment has changed over time is to look at the interaction between a company's share price and its earnings per share (EPS).
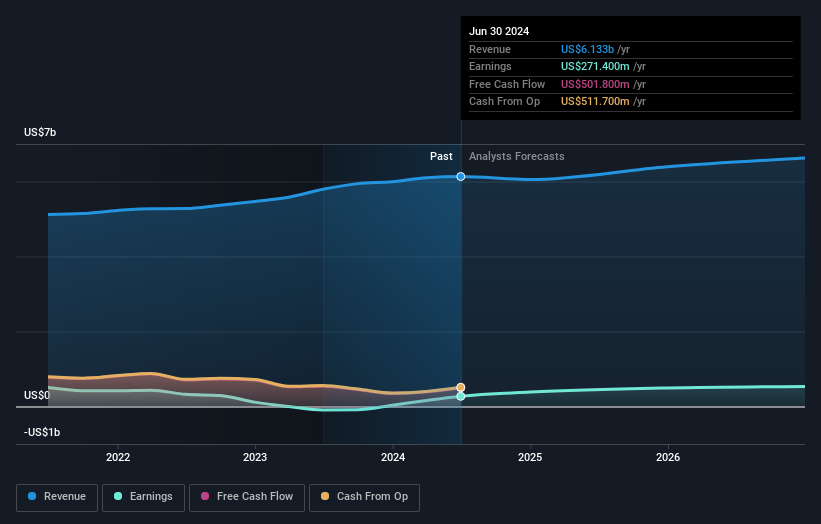
During the last year Hanover Insurance Group grew its earnings per share, moving from a loss to a profit.
When a company has just transitioned to profitability, earnings per share growth is not always the best way to look at the share price action.
We think that the revenue growth of 5.9% could have some investors interested. We do see some companies suppress earnings in order to accelerate revenue growth.
The image below shows how earnings and revenue have tracked over time (if you click on the image you can see greater detail).
We know that Hanover Insurance Group has improved its bottom line lately, but what does the future have in store? You can see what analysts are predicting for Hanover Insurance Group in this interactive graph of future profit estimates.
What About Dividends?
When looking at investment returns, it is important to consider the difference between total shareholder return (TSR) and share price return. The TSR incorporates the value of any spin-offs or discounted capital raisings, along with any dividends, based on the assumption that the dividends are reinvested. It's fair to say that the TSR gives a more complete picture for stocks that pay a dividend. We note that for Hanover Insurance Group the TSR over the last 1 year was 26%, which is better than the share price return mentioned above. The dividends paid by the company have thusly boosted the total shareholder return.
A Different Perspective
We're pleased to report that Hanover Insurance Group shareholders have received a total shareholder return of 26% over one year. And that does include the dividend. That's better than the annualised return of 3% over half a decade, implying that the company is doing better recently. Given the share price momentum remains strong, it might be worth taking a closer look at the stock, lest you miss an opportunity. Most investors take the time to check the data on insider transactions. You can click here to see if insiders have been buying or selling.
For those who like to find winning investments this free list of undervalued companies with recent insider purchasing, could be just the ticket.
Please note, the market returns quoted in this article reflect the market weighted average returns of stocks that currently trade on American exchanges.
Valuation is complex, but we're here to simplify it.
Discover if Hanover Insurance Group might be undervalued or overvalued with our detailed analysis, featuring fair value estimates, potential risks, dividends, insider trades, and its financial condition.
Access Free AnalysisHave feedback on this article? Concerned about the content? Get in touch with us directly. Alternatively, email editorial-team (at) simplywallst.com.
This article by Simply Wall St is general in nature. We provide commentary based on historical data and analyst forecasts only using an unbiased methodology and our articles are not intended to be financial advice. It does not constitute a recommendation to buy or sell any stock, and does not take account of your objectives, or your financial situation. We aim to bring you long-term focused analysis driven by fundamental data. Note that our analysis may not factor in the latest price-sensitive company announcements or qualitative material. Simply Wall St has no position in any stocks mentioned.
About NYSE:THG
Hanover Insurance Group
Through its subsidiaries, provides various property and casualty insurance products and services in the United States.
Established dividend payer with adequate balance sheet.
