
Quote of the Week: “It is not the market that is rising or falling at any moment, even if we commonly speak as though it were. In truth, prices move in response to the buying and selling decisions of countless investors, who are constantly considering the likely decisions of countless others.” - Peter Bernstein
A perfect storm swept through global equity markets last week. The jury is still out on whether this was a blip or the start of a bigger downturn. There were quite a few catalysts behind the sudden increase in volatility, and investors will need to keep an eye on them over the next few weeks and months.
This week we are unpacking 5 of these catalysts and how important they really are in the medium and longer term. We’ve also got 3 timeless principles to help you make the most of any market volatility and reduce the anxiety that comes with it.
🎧 Would you prefer to listen to these insights? You can find the audio version on our Spotify, Apple podcasts or Youtube !
What Happened in Markets this Week?
Here’s a quick summary of what’s been going on:
-
🧑⚖️ Google loses landmark US antitrust case over search dominance ( The Financial Times )
- What’s our take?
- Google may have a tougher time striking deals with the likes of Apple if the DoJ has its way. While no remedies or penalties have been determined yet, Google may be blocked from striking deals with manufacturers, browser developers and wireless carriers to be the default search engine. This could impact its reach and dominance in online search, as those providers could use alternatives.
- However, customers may prefer to stick with Google as their browser choice even if it isn’t the default option, simply due to how good Google search is. Companies like Apple should be somewhat concerned though, given Google paid Apple some $20bn in 2022 alone, which was 25% of its services revenue. Alphabet plans to appeal the ruling.
- What’s our take?
-
🏢 Many top office lenders continue to dial back exposure ( S&P Global )
- What’s our take?
- The pain in office real estate continues, and banks are adjusting accordingly. Many banks are decreasing their office real estate exposure of their loan portfolios and at the same time, they’re increasing their reserves against what remains in their portfolio. The amount of non-performing loans also increased quarter on quarter for most of the banks. Some are managing well, with 0.5-2% of their investments being classified as “non-performing”, while others are having a tougher time with 11-16% of their office loan book classified as non-performing.
- The silver lining is that as a proportion of their gross loans held for investment, they aren’t heavily invested. These office investments typically range in the mid-single digits in terms of their total loan portfolio, so they aren’t too exposed to the weakness.
- What’s our take?
-
📈 Palantir shares surge after raising annual revenue forecast on AI strength ( CNBC )
- What’s our take?
- While some companies may take years to see payoffs from their huge AI investments, as we covered last week, other companies like Palantir can benefit from the same AI trend, but receive revenue sooner and spend less too!
- Palantir helps companies overcome the challenge of building AI application prototypes and deploying finished products to their customers. The generative AI boom is driving demand for their services, so while AI investment is still growing, Palantir is well-positioned to benefit. Plus, investors were happy to see that it’s becoming less reliant on its revenue from governments, which reduced to 54% of total sales.
- What’s our take?
-
🤖 SaaS companies like Shopify and Datadog also leveraging AI ( WSJ )
- What’s our take?
- Shopify and Datadog both reported strong quarterly results and raised forward revenue guidance. Like Palantir, both also cited demand for their AI-powered tools as reasons for the improving outlook.
- SaaS companies are incredibly well-placed to capitalise on generative AI. By adding AI-powered tools to their product suite, they can sell new products to existing customers, and increase the value proposition when selling to new customers.
- At this stage, there’s probably a lot of spin going on during earnings calls. Investors will need to read between the lines to separate the real traction from the PR.
- What’s our take?
-
💻 The market hasn’t been forgiving of Intel’s woes ( The Verge )
- What’s our take?
- Intel has been at the center of a number of controversies in recent months. The company’s latest earnings call came as a disappointment for investors, as Intel made the call to suspend its dividend moving forward. Profitability came in below expectations, sparking Intel’s call to implement a $10 Bln cost-reduction plan for 2025.
- Intel’s earnings call highlighted the need to “chop some wood” to get profitability in check. Unfortunately, this wood chopping seems to be manifesting itself as a 15% reduction in head count and a number of reductions in employee benefits.
- Intel isn’t just struggling on the market, as it’s come to light that their 13th and 14th Gen desktop processors have been plagued with issues that Intel isn’t being transparent about. A manufacturing defect first spotted in 2022 was supposedly rectified in early 2023, however Intel has admitted that impacted CPUs may still have been on retailers shelves as late as 2024.
- Up to 70% of Intel’s 13th and 14th Gen CPUs are potentially impacted by the manufacturing defect and a further issue that stemmed from a voltage issue pushed in a previous microcode update.
- What’s our take?
-
🛢️ Oil slumps to fresh seven-month low amid global financial rout ( Bloomberg )
- What’s our take?
- Concerns of a slowdown in global economic growth have driven the price of oil lower these last few weeks. Commodity analysts have shown that at a ratio of 5:1, most of the downward revision has been from the rapid closing of long positions, rather than the initiation of short positions. What’s likely prevented the oil price from declining further is increased tensions in the Middle East and muted oil production growth from the U.S. Just remember, commodity supply and demand vary far less than prices suggest, but even slight imbalances can cause large swings in price.
- What’s our take?
🤯 Managing Market Mania
Weaker economic data and last Monday’s global equity market selloff prompted the media to put nearly all the blame on the rising odds of a US recession. However, there were actually a few other catalysts behind the increased volatility.
At least five catalysts happened to coincide in a perfect storm between the 1st and 5th of August:
- The return of the R-word
- The BOJ and the carry trade
- A mediocre earnings season
- Berkshire dumps Apple
- US election polls
Let’s go through each of them!
📉 The Return Of The R Word
Firstly, the US yield curve inverted in April 2022 and for the remainder of 2022 and 2023, a recession seemed inevitable for the US economy.
However, that predicted recession didn’t materialize (though it did in many other economies), and it began to look like the Fed pulled off the impossible and managed to engineer a ‘soft landing’.
That changed last week when a string of US economic data releases took the market by surprise. The unemployment rate rose from 4.1% to 4.3% in July, which was unexpected. In addition, the ADP employment and non-farm payroll reports showed fewer new jobs being created than economists had forecast.
Besides the weak jobs data, the ISM Manufacturing Production and Chicago PMI indexes fell more than expected.
The higher unemployment rate also triggered the Sahm Rule recession indicator. You may be thinking: “ The what? ”
✨ This indicator compares the 3-month average unemployment rate to the 12-month low point. It triggers when the difference exceeds 0.5%, and suggests a recession has begun or is imminent. It differs from the yield curve inversion indicator, which suggests a recession is on the horizon rather than imminent.
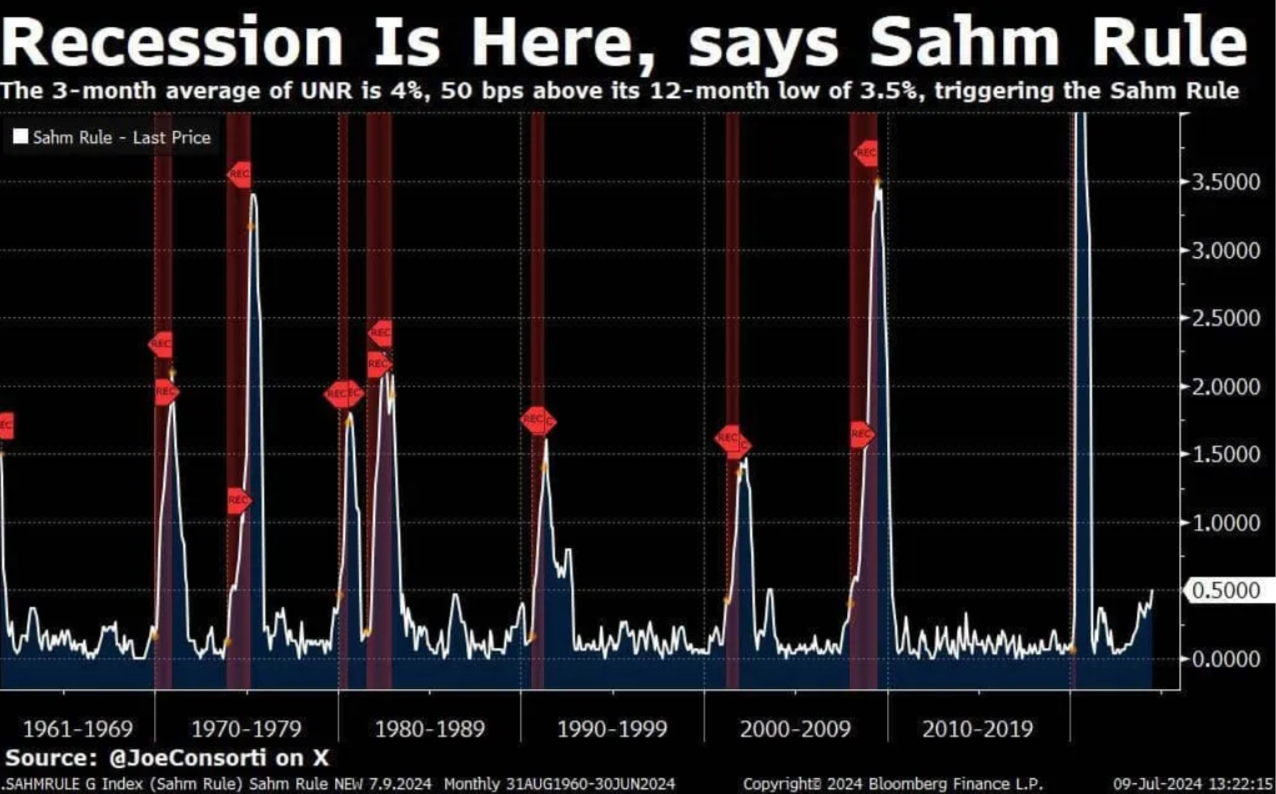
The Sahm Rule has a very good track record, but there are some caveats to note:
- Claudia Sahm, who developed the indicator, pointed out that its historical accuracy doesn't mean it will never be wrong. She also said she doesn’t think a recession has begun - but the odds are rising.
- Recessions don’t typically begin with unemployment rates as low as they are now. That’s not to say there isn’t evidence where they can.
- The current cycle is far from typical. Usually, an overheated economy causes inflation, which leads to rate hikes. This cycle started with rising inflation due to inflated money supply, a constrained supply chain, and Russia’s invasion of Ukraine. GDP growth has improved in spite of higher interest rates.
✨ Officially, the expected recession hasn’t occurred yet. But there have actually been a series of sector-specific recessions. The tech and real estate sectors both experienced recessions. There have also been rolling recessions in most other economies around the world.
If there is another sector-specific recession beginning now, it’s probably in consumer-facing businesses. The worst performing US sector in the seven days to 9th August was consumer discretionary. Within the sector, most industries fell sharply:
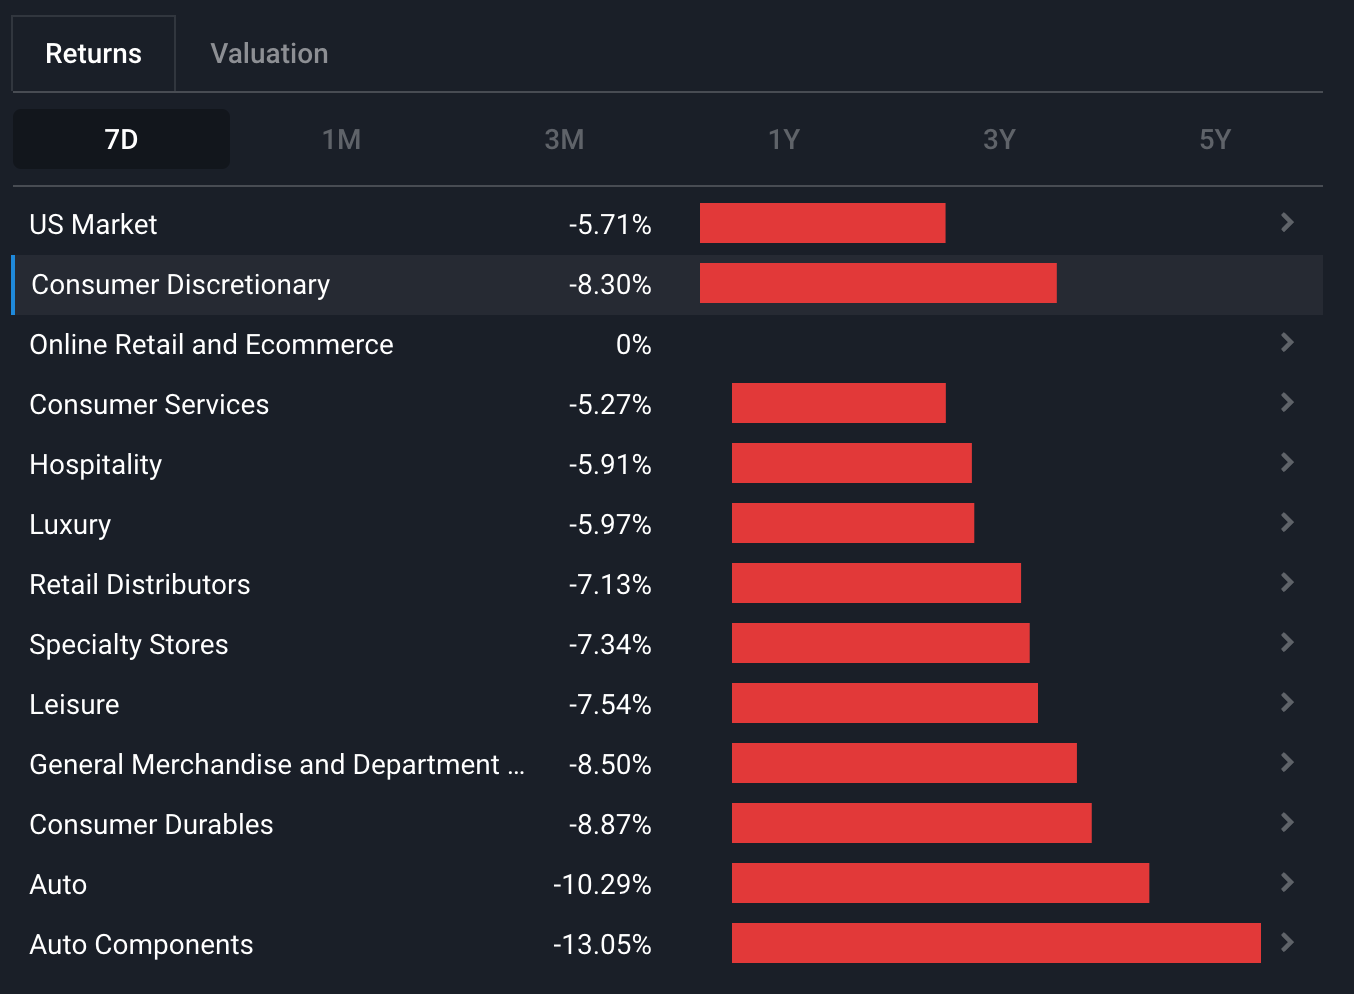
During several Q2 earnings calls, weakening consumer demand was mentioned.
In 2023 companies managed to raise prices without losing too many customers, but that appears to be changing now. This has been particularly true for the travel and leisure industry. Disney and Airbnb both mentioned that consumers have become more price-sensitive.
There is also evidence that rising unemployment is affecting the lowest-paid workers the most. Many of these consumers don’t have savings to fall back on, so the impact on demand is fairly direct.
✨ Consumer spending makes up about 70% of US GDP, so weakening consumer demand is a big deal. So far the effect on overall demand has been marginal, but the concern is warranted.
💸 The BOJ And The Carry Trade
Have you heard of the Yen Carry trade ? A carry trade is simply borrowing capital at one interest rate and then investing that capital in an investment paying a higher interest rate.
Carry trades are executed in various ways, involving different currencies and interest-yielding assets all over the world. But, the Japanese Yen carry trade dwarfs all the other versions and has been a popular strategy for decades. This is because Japan’s interest rates have been at and below zero for the last 25 years.
✨ Carry trades can be very profitable, but they come with several risks. A cross-border carry position is exposed to two interest rates and an exchange rate. The Yen vs US Dollar carry was particularly exposed as Japan’s rates are now rising while US rates are falling (or likely to).
Typically, capital raised from the Yen carry trade is invested in US government bonds, as well as government bonds in other countries with stable currencies and higher yields. But this capital can also find its way into equity markets too.
In March, the Bank of Japan raised its overnight rate from -0.1% to 0.1% and began to end its yield control policies. Then on 31st July, the BOJ lifted the rate to 0.25% and suggested
it would continue raising rates and reduce its bond buying. This led to a strengthening Japanese currency and forced investors to unwind their carry trades.
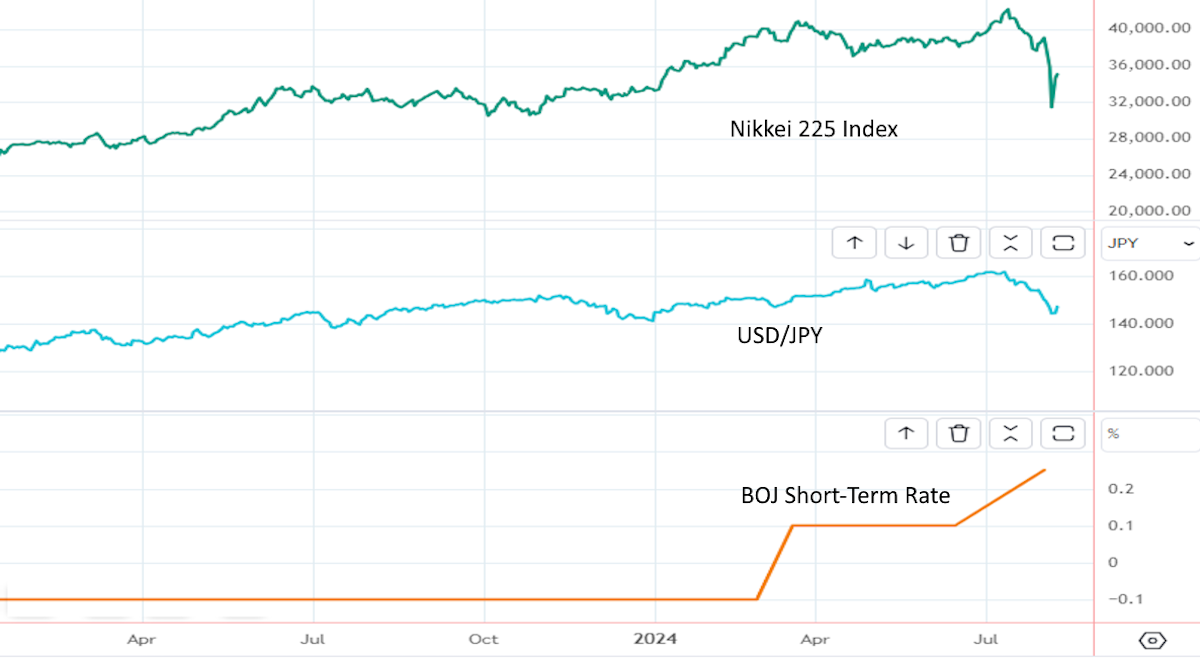
Foreign investors holding Japanese equity positions weren’t necessarily exposed to the carry trade, but they sold stocks anyway as the perceived risk increased. Japan's benchmark index fell as much as 20% in three days which added to the negative sentiment across the globe.
An interesting outcome of this was the fact that US bond yields fell. Investors with positions that were short JPY and long US treasuries would have had to sell the US bonds - BUT that was offset by a bigger ‘flight to safety trade’ as investors bought bonds and sold stocks.
😬 A Mediocre Earnings Season
The third catalyst that drove the volatility was a mixed performance from earnings season so far.
✨ The number of companies beating EPS estimates was higher than average, but the magnitude of those positive surprises was lower than average. On the revenue side, the number and magnitude of positive surprises were below average.
EPS estimates for Q3 fell 1.8% during July, which is in line with the average reduction during the first month of the quarter over the last five years.
The good news has been that while positive surprises were below average, earnings and revenue growth rates continued to rise.
The above stats are for companies in the S&P 500 index, and 86% of those companies have now reported Q2 results. Still to come are smaller companies, and many of the retailers, so this picture could change.
🍎 Berkshire Halves Apple Stake
When the Oracle of Omaha acts, most investors pay attention.
Berkshire Hathaway’s quarterly results happened to coincide with the weak jobs report and the BOJ spooking the market. The results included two pieces of information that added fuel to Monday’s market selloff.
- Firstly, Berkshire disclosed that it had sold more than 50% of its Apple stake - after a similar large sale in Q1.
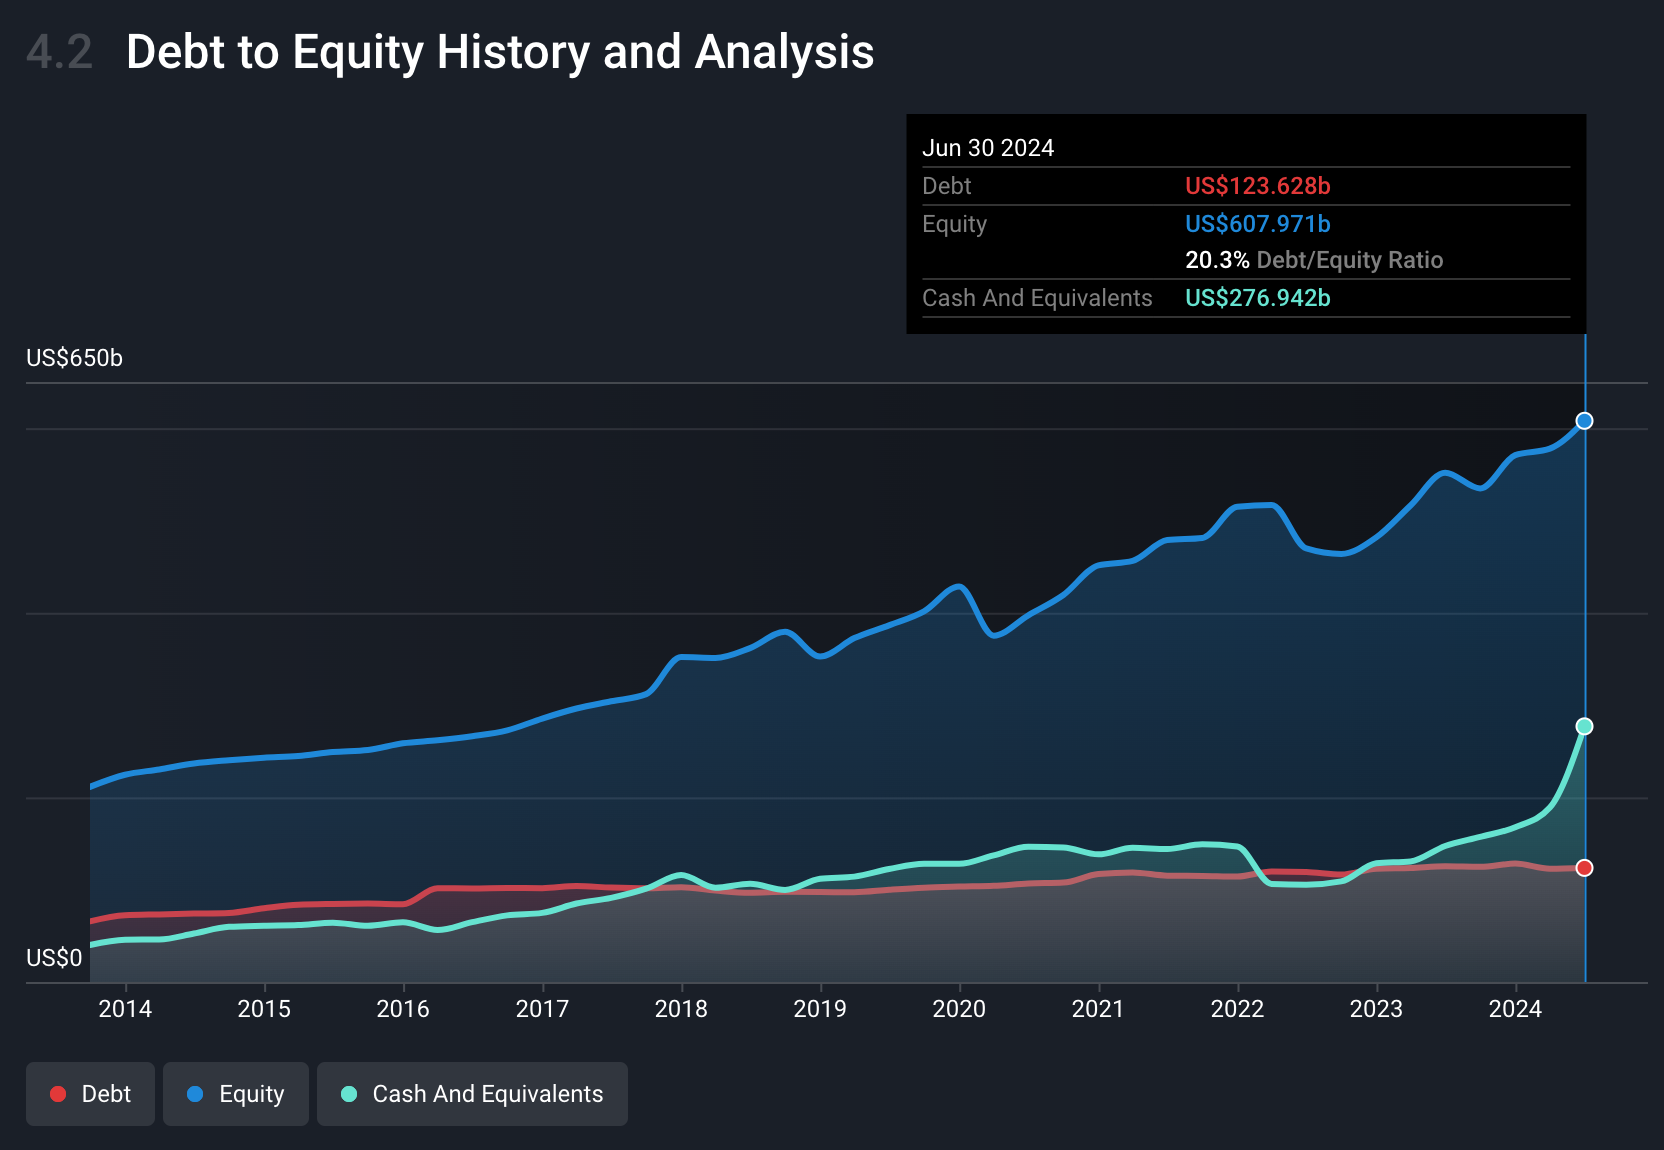
- And secondly, the company’s cash position is now at a record $276 billion , which is 45% of BRK’s equity value. Despite raising all that cash, the company only bought back $356 million of its own stock during the quarter, the lowest in at least five years.
- Also, fun fact, BRK now owns more short-term US treasuries than the Federal Reserve 😅
How did the market interpret this?
✨ Well, the hot take on this news is that Berkshire thinks that its own share price and Apple’s are too high and that Buffett and company don’t see value in the rest of the market either.
Taking a step back, it’s worth pointing out that a year ago investors were concerned about the Apple stake being too big, but now it’s less than 30% of the company's equity investments. In addition, Berkshire’s real problem is finding investments big enough to move the needle.
For now, we can assume he sees it as more prudent to hold roughly $250bn in highly liquid short-term US treasuries that yield him around 5% annually. This would generate Berkshire about $10bn per year in interest income, which is just incredible.
🇺🇸 US Election Polls
Lastly, one other catalyst that may be weighing on the market is US election polling.
National polls now show Donald Trump and Kamala Harris just about tied in their race for the White House. That implies peak uncertainty.
With everything else that is happening, the election is probably a minor factor - but it’s very likely to become a more important factor in the coming months, particularly if the other risks fade.
What’s Next?
So, was the selloff an overreaction, or the start of a larger decline? While the BOJ’s actions created forced sellers, the other catalysts have more to do with sentiment. The weaker data from the US is a negative catalyst, but that could be offset by accelerated rate cuts. And some like Blackrock think the recession fears are overblown.
The BOJ has also stated that it won’t raise rates if markets are unstable. A strategist at UBS believes the global carry trade reached about $500 billion, and about 40% of that has now been unwound. If that’s true, there could be more unwinding ahead, but it won’t be as much of a surprise as it was last week.
Initially, there were calls for an emergency Fed rate cut, but that seems unlikely unless a bigger crisis develops. But, we do know that central banks are prepared to act (i.e. cut rates fast) when necessary.
The Vix index measures the volatility implied by 30-day options on the S&P Index. The current level of 25 is nowhere near the highest peaks, but still well above baseline levels observed over the last 20 years. This suggests that perceived risk is still quite high.
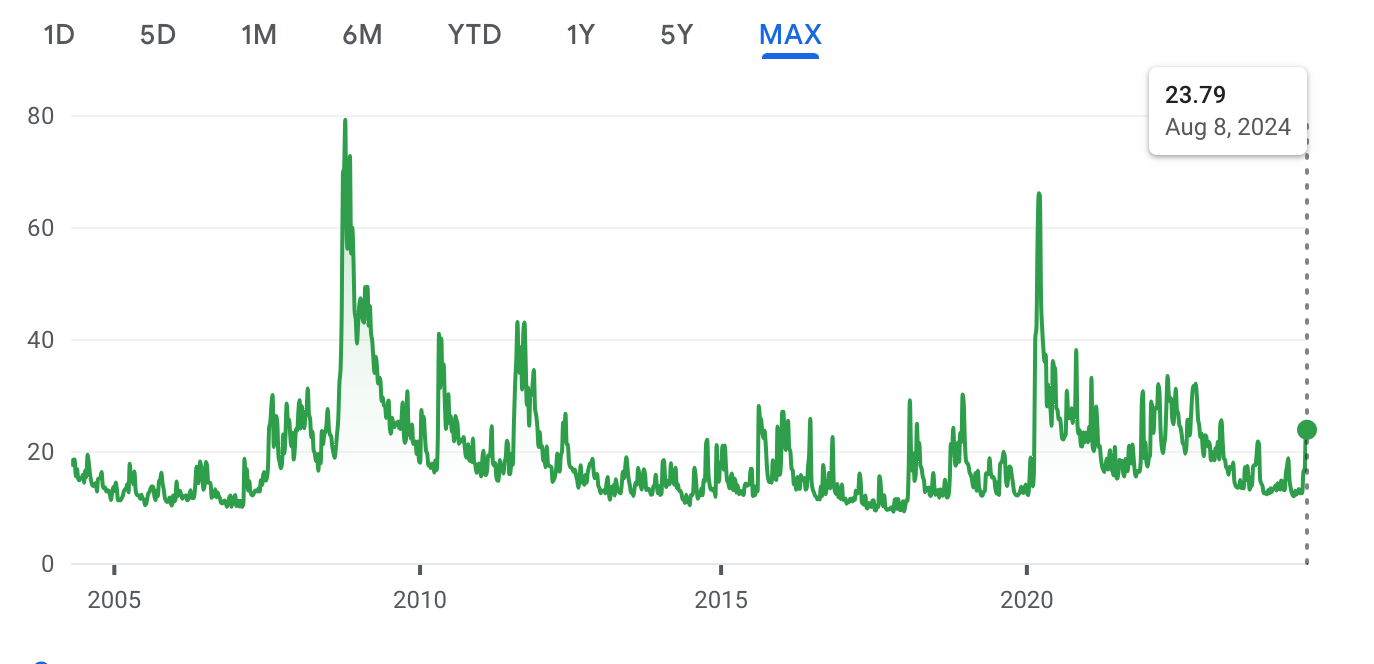
✨ Looking at the chart, you’ll notice that a spike like the current one is often followed by a series of similar spikes over a 3 to 6-month period. Given enough time, these spikes have also turned out to be great buying opportunities, which leads us to our insight this week.
💡 The Insight: Make The Most Of The Market’s Volatility
If you panicked and had a few sleepless nights last week, you weren’t alone.
Sudden mini-crashes like this are actually a good way to test your pain tolerance. If you find the anxiety unbearable, you’re probably taking too much risk. So you might need to reduce your leverage or exposure to volatile assets and increase exposure to less volatile ones.
Managing your psychological capital is arguably as important as managing your financial capital. If you take more risks than you can tolerate, you are more likely to make emotional decisions, which could get you in trouble.
So when your portfolio accurately accounts for your personal risk tolerance, how can you then make the most of the volatility when it inevitably comes?
Here are 3 ways to prepare yourself to make the most of volatility:
- 🧮 Estimate your own fair values.
- When you build a narrative and fair value estimate for each company you’re invested in or watching, you’ll see your investments in a new light. You’ll notice the underlying value of a company varies a lot less than its stock price does.
- If you’ve done your research, built a narrative and estimated a fair value that you have conviction in, it will be a lot easier to feel calm during volatile periods. You’ll know how to act when there’s volatility to both the downside and the upside.
- We made a short video to show you how to create a narrative and valuation in just 3 minutes on the platform. If you do this for every stock you own or watch, you’ll be calm, confident and ready to pounce when opportunity strikes. Which leads us to our next point.
- 💰 Keep cash at the ready.
- As Warren Buffett says, it’s hard to shoot a rare pink elephant if you’re not carrying a loaded shotgun. In other words, it’s hard to take advantage of rare stock market opportunities if you don’t have cash on the sidelines ready to deploy quickly.
- When that stock on your watchlist suddenly becomes undervalued against your fair value estimate because the market is diving but nothing has changed about its future prospects, how can you act decisively?
- If you don’t have the cash ready and waiting, but you want to buy it, you either have to sell some other holding you have, which could be horrible timing if it’s also declined, or you have to sit and watch an opportunity pass you by.
- Buffett is arguably the greatest investor of all time, but he would have had trouble achieving that status if he was always fully invested and didn’t have the cash to deploy during those rare opportunities when the market was selling off hard and offering him bargains.
- 🗓️ Focus on the long term.
- When volatility strikes, most investor's already short time horizons often get shorter and shorter. But for those who can look past the short term and picture where things might be in 3,5 or 10 years, they’re the ones who typically come out best. So for us to be like them, we need to make sure we’re always assessing current developments against the longer-term prospects.
Key Events During the Next Week
Tuesday
- 🇬🇧 UK Unemployment data will be released. Economists are expecting unemployment to remain at 4.4%.
- 🇺🇸 US Producer prices are estimated to have risen 0.1% in July, down from 0.2% in June.
Wednesday
- 🇬🇧 The UK’s annual inflation rate, currently sitting at 2%, will be published.
- 🇺🇸 The US consumer inflation rate is expected to fall from 3% to 2.9%.
Thursday
- 🇯🇵 Japan’s second-quarter GDP estimate is forecast to be 2.1% compared to -2% in the first quarter.
- 🇨🇳 China’s retail sales are forecast to be up 2.6% compared to 2% in the previous period. Industrial production is expected to be down slightly at 5.2%.
- 🇬🇧 UK GDP data is forecast to show the economy growing at 0.9% in the second quarter, compared to 0.3% in the first quarter.
- 🇺🇸 US initial jobless claims are estimated to be higher at 239k, up from 233k last week.
Friday
- 🇺🇸 US building permits will be published. Economists expect to see 1.44 mln new permits, up from 1.14 mln.
The big retailers will start reporting this week, along with a handful of other large-cap stocks:
Have feedback on this article? Concerned about the content? Get in touch with us directly. Alternatively, email editorial-team@simplywallst.com
Simply Wall St analyst Richard Bowman and Simply Wall St have no position in any of the companies mentioned. This article is general in nature. We provide commentary based on historical data and analyst forecasts only using an unbiased methodology and our articles are not intended to be financial advice. It does not constitute a recommendation to buy or sell any stock and does not take account of your objectives, or your financial situation. We aim to bring you long-term focused analysis driven by fundamental data. Note that our analysis may not factor in the latest price-sensitive company announcements or qualitative material.
Richard Bowman
Richard is an analyst, writer and investor based in Cape Town, South Africa. He has written for several online investment publications and continues to do so. Richard is fascinated by economics, financial markets and behavioral finance. He is also passionate about tools and content that make investing accessible to everyone.