
Quote of the Week: “My experience teaches me that by far the largest losses have been sustained by investors through buying securities of inferior quality under favorable general conditions.” - Benjamin Graham
The last four weekly newsletters have been devoted to the semiconductor industry. If you missed any of them, here they are:
- Industry overview and memory ICs
- Analog and mixed-signal ICs
- Logic ICs
- The chip manufacturing process and supply chain
This week we are wrapping up the series with a look at the industries and end-markets that buy all those chips and the underlying causes of industry earnings cycles.
🎧 Would you prefer to listen to these insights? You can find the audio version on our Spotify, Apple podcasts or Youtube !
What Happened in Markets this Week?
Here’s a quick summary of what’s been going on:
-
💾 Big Tech keeps the datacenter investment train going ( FT )
- What’s our take?
- Last week we mentioned that Alphabet’s capital expenditure rose 9% from the first to second quarter. That suggested spending on datacenter infrastructure (i.e. GPUs etc.) were still rising, but not at the same pace of prior quarters.
- This week, Microsoft and Meta reported capex that was nearly 30% higher than the first quarter. Amazon’s capex rose 18%, though that was for the entire company, including e-commerce.
- How soon these companies realize a return on these investments remains to be seen, but they all have cash sitting idle on their balance sheets. They can’t make acquisitions due to regulatory pressure, so they can either buy back stock (which many are doing anyway) or invest in future capacity.
- What’s our take?
-
🛍️ Temu faces backlash from suppliers ( SCMP )
- What’s our take?
- PDD’s Temu is facing protests from suppliers over fines, withdrawal limitations and other measures being taken by the platform. Temu’s suppliers have always had to do with narrow margins in return for higher volumes - but those margins are now being squeezed even more.
- Temu is a two-sided marketplace which aggregates buyers and sellers like Uber , Airbnb and others. The playbook for platforms like this is becoming very familiar. First, you aggregate all the sellers by offering attractive terms. Then you use all those sellers to attract and aggregate all the buyers. Once you’ve aggregated the buyers, you have more leverage over the sellers, and you can change the terms.
- Ultimately, the system needs to be sustainable for the sellers, or it falls apart. Let’s see how this plays out.
- What’s our take?
-
🏦 US Community banks are still under some pressure ( S&P Global )
- What’s our take?
- US regional and community banks faced a crisis in the wake of SVB’s collapse last year. That storm is mostly in the rearview mirror, but community banks are still under pressure. Community banks experienced the largest decline in deposits in the second quarter.
- Overall deposits at US banks fell 1.4% during the quarter, while many of the community banks saw deposits falling by 5 to 10%. Smaller banks don’t have the resources or flexibility to offer higher savings rates, which makes it difficult to remain competitive and can cause customers to shift to larger banks.
- This shouldn’t be a problem unless there's another liquidity crunch, in which case these banks may be vulnerable due to excessive consolidation.
- What’s our take?
-
💸 Investors embrace bond funds ahead of expected rate cuts ( WSJ )
- What’s our take?
- As tech stocks fell last week, US 10-year bond yields dipped below 4% for the first time since January. This was partly a case of ‘flight to safety’ but bond yields were already falling ahead of the weakness in equities. Bonds funds have also seen inflows, as investors look to lock in higher yields.
- Economic data and recent comments from central bankers suggest the likelihood that rates have indeed peaked. That means the yields currently available from bonds might not be on offer for a while.
- With volatility picking up for technology stocks, bonds may also appear tempting. But there are 10 other equity market sectors to consider, most of which have lagged the market.
- What’s our take?
-
FT releases Inflation and Interest Rate Tracker ( FT )
- What’s our take?
- The FT recently published a handy tool to visualize the path of interest rates and inflation in just about every country. You can compare your home country, and economies where you hold investments, to those with similar economies.
- As rates begin to fall, it’s worth paying attention to their likely path, as well as the potential impact on currencies.
- Remember, on a relative basis: Lower inflation → lower interest rates → weaker currencies → better for exporters and worse for importers. In countries where inflation remains stubbornly high, the opposite could occur.
- Expectations of falling rates could also trigger more rotation to bonds as investors look to lock in higher yields while they can.
- What’s our take?
🔁 Semiconductor Markets and Cycles
Generally, trying to time the market isn’t a great idea, the age-old adage tells us that “time in the market is better than timing the market”. However, when it comes to cyclical industries, timing becomes much more important. You may plan to hold an investment indefinitely, but if you buy at the top of a cycle, your investment could be underwater for a very long time.
If you are assessing a semiconductor company, there are three things to consider:
- The company itself , including its competitive position.
- The industries and end markets the company serves
- The current cycles affect the broader industry and the company’s specific end markets.
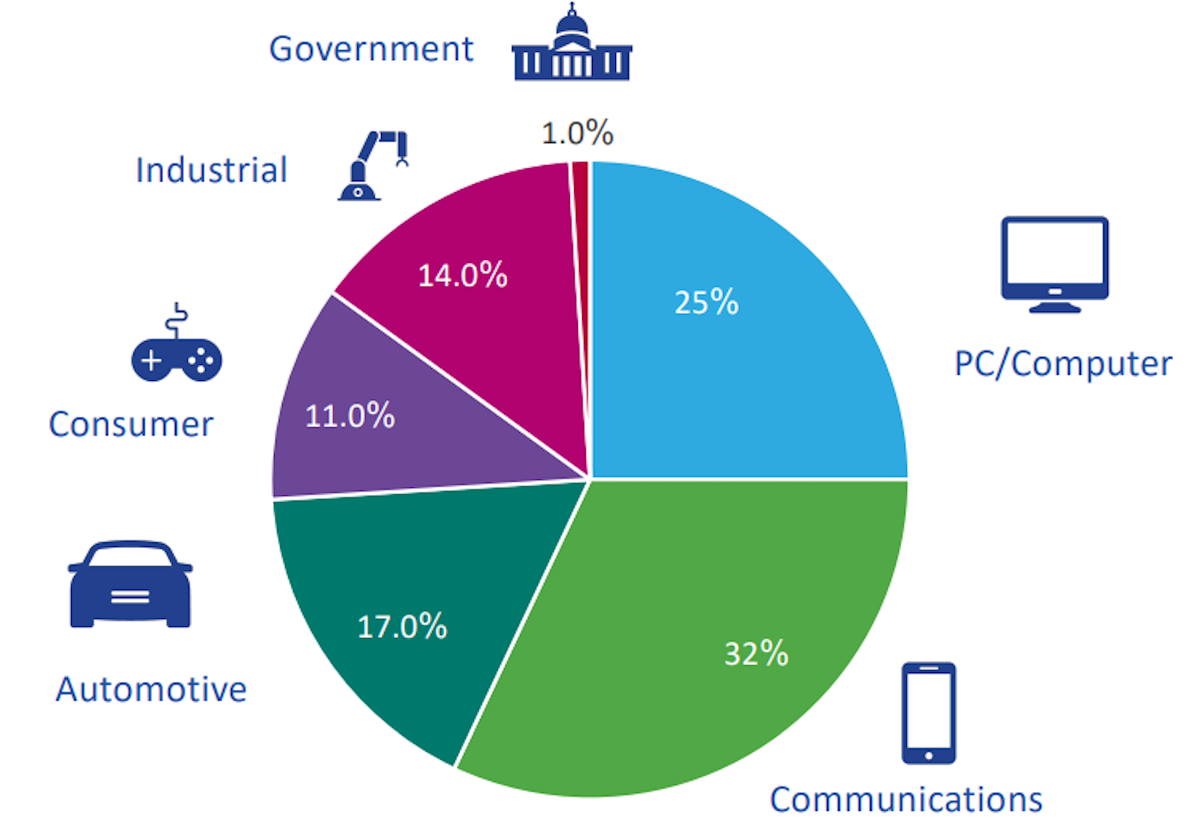
💰 Who’s Buying the Chips?
In 2023, global semiconductor sales amounted to $527 billion. The chart below from the Semiconductor Industry Association breaks down this revenue by end-use industry. There’s a lot of convergence happening across these industries, so there is a lot of overlap across the industries.
☁️ Data Centers: AI and Cloud Infrastructure
Data center infrastructure includes both PC/Compute and Communications equipment. This market has experienced two booms in the past decade, first with cloud computing and currently with generative AI.
Nvidia has been the big winner thanks to its H100 Tensor Core GPUs. But there are plenty of other companies supplying the market with logic chips ( Intel and AMD ), networking chips ( Broadcom and Marvell ) and memory products ( Micron and SK hynix ).
Some analysts believe the current boom is in bubble territory, and there are obvious parallels to draw with the late 1990s. A recent essay by David Cahn from Sequoia Capital suggested that the companies investing in AI infrastructure will need to generate $600 billion in revenue to justify those investments. The current annual run rate is probably close to $10 billion - so there’s a long way to go.
The current round of investments won’t continue forever, but could continue for longer than many expect. Alphabet’s CEO Sundar Pichai said the risk of underinvesting is dramatically greater than the risk of overinvesting. Meta’s Mark Zuckerberg said, "Because the downside of being behind is that you’re out of position for the most important technology for the next 10 to 15 years." Both Microsoft and Meta’s capital expenditure increased by close to 30% between the first and second quarter, while Alphabet’s slowed to 9%.
In addition, the investments these companies are making don’t all need to result in revenue from AI. The same infrastructure can be used internally, and to provide their other cloud services.
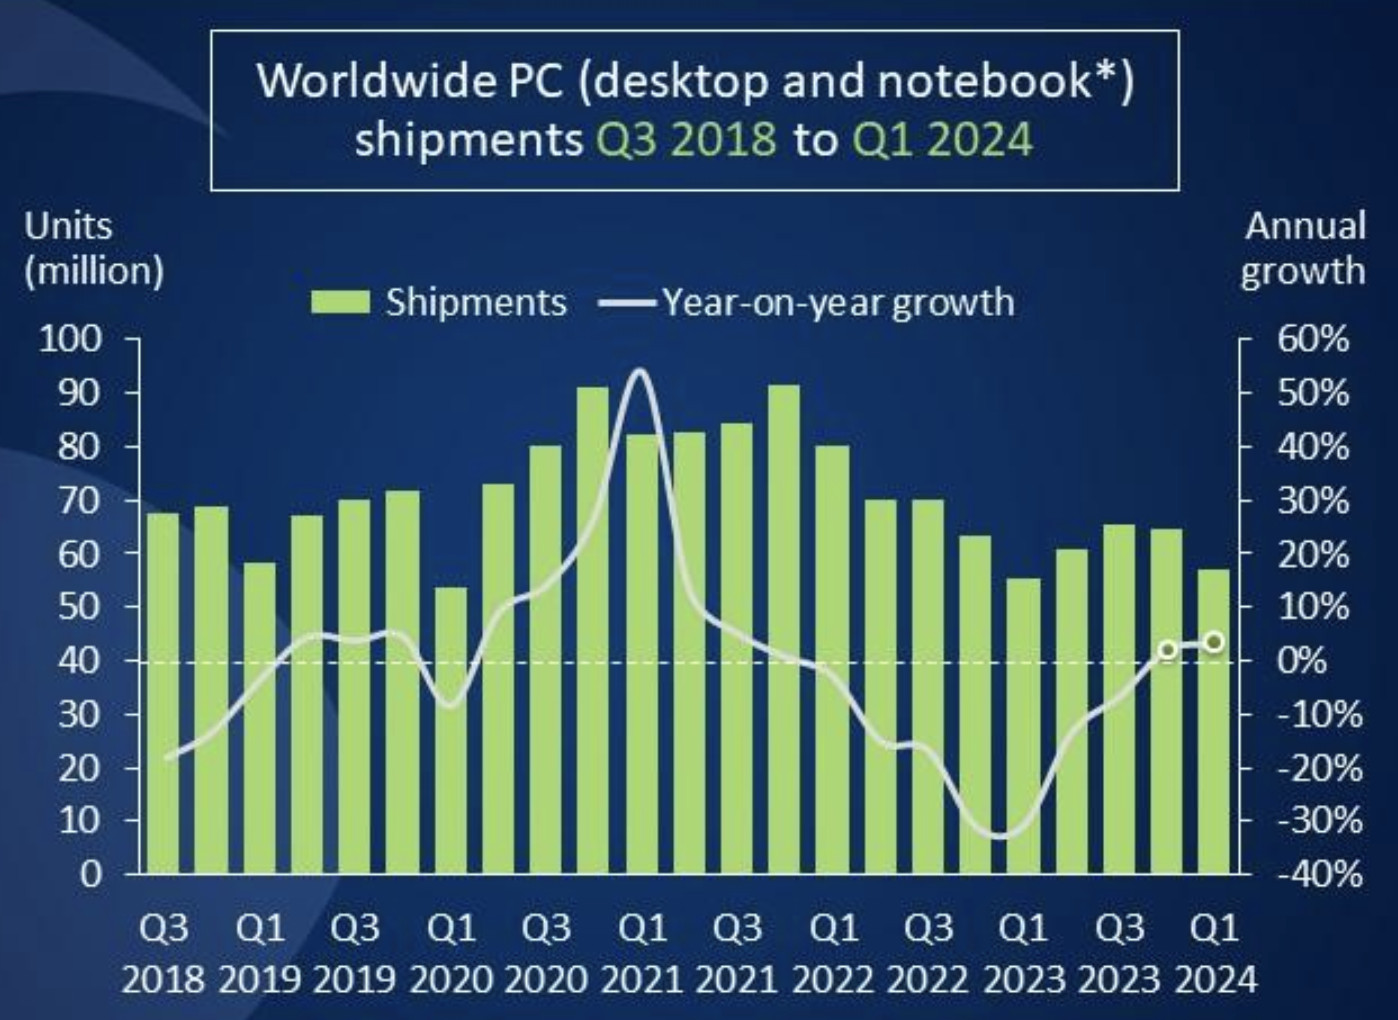
💻 PCs and Smartphones
Desktop PC, notebook, tablets and smartphone manufacturers together make up around 50% of global semiconductor revenue. These devices are replaced at regular intervals, which makes these end markets more cyclical than others.
The apps and software we all use these devices to access demand increasing amounts of processing power and memory. This means the chips that go into them are often close to the leading edge. More powerful processors and memory chips use more power, so each upgrade in performance also requires upgraded batteries and power management ICs too.
The PC market experienced an abnormally big up-cycle in 2020 as remote work became the norm. This pulled demand forward, and resulted in a longer lump than usual. The market is recovering, but the recovery has been slower than expected.
The smartphone market is slightly less cyclical due to iPhones and Android phones being more distinct markets. Nevertheless, it’s still cyclical and subject to replacement cycles.
🛜 Communication and Networking
ICs used for communication form a crucial part of data center infrastructure. They are also used for wired and wireless networks, without which the digital economy wouldn’t exist.
Telecom networks are more established and less of a growth industry than they were a few decades ago. Nevertheless, new technologies like broadband fiber and 5G have resulted in substantial investment cycles.
📺 Consumer Electronics and Appliances
Household appliances and electronic products are one of the oldest markets for chips, particularly analog chips. But the growing number of connected and smart devices means demand for sophisticated chips and microcontrollers is growing.
🚗 Automotive and Industrial
The auto industry is an increasingly important market for semiconductors. Most modern vehicles have at least 1,000 different chips in them, and that rises to well over 3,000 for electric vehicles - and even more for those with autonomous driving capabilities. For gas-powered vehicles, most of those chips are fairly ‘low tech’ sensors and power management ICs. But EVs need more sophisticated tech to optimize power deployment, and autonomous vehicles require the most sophisticated processors and sensors available.
Automation is also taking over factories and supply chains. So, while demand for analog chips will continue, demand for processors and memory chips will increase. Adding to this demand are industries like the internet of things and health-tech.
Unlike the other industries mentioned above, which have seen increasing demand over the last year, the auto and industrial markets have been in a slump recently.
🪖 Government, Aerospace and Defense
This is the smallest end market - but new frontiers like space travel, as well as increasing defense spending, suggest it shouldn't be overlooked.
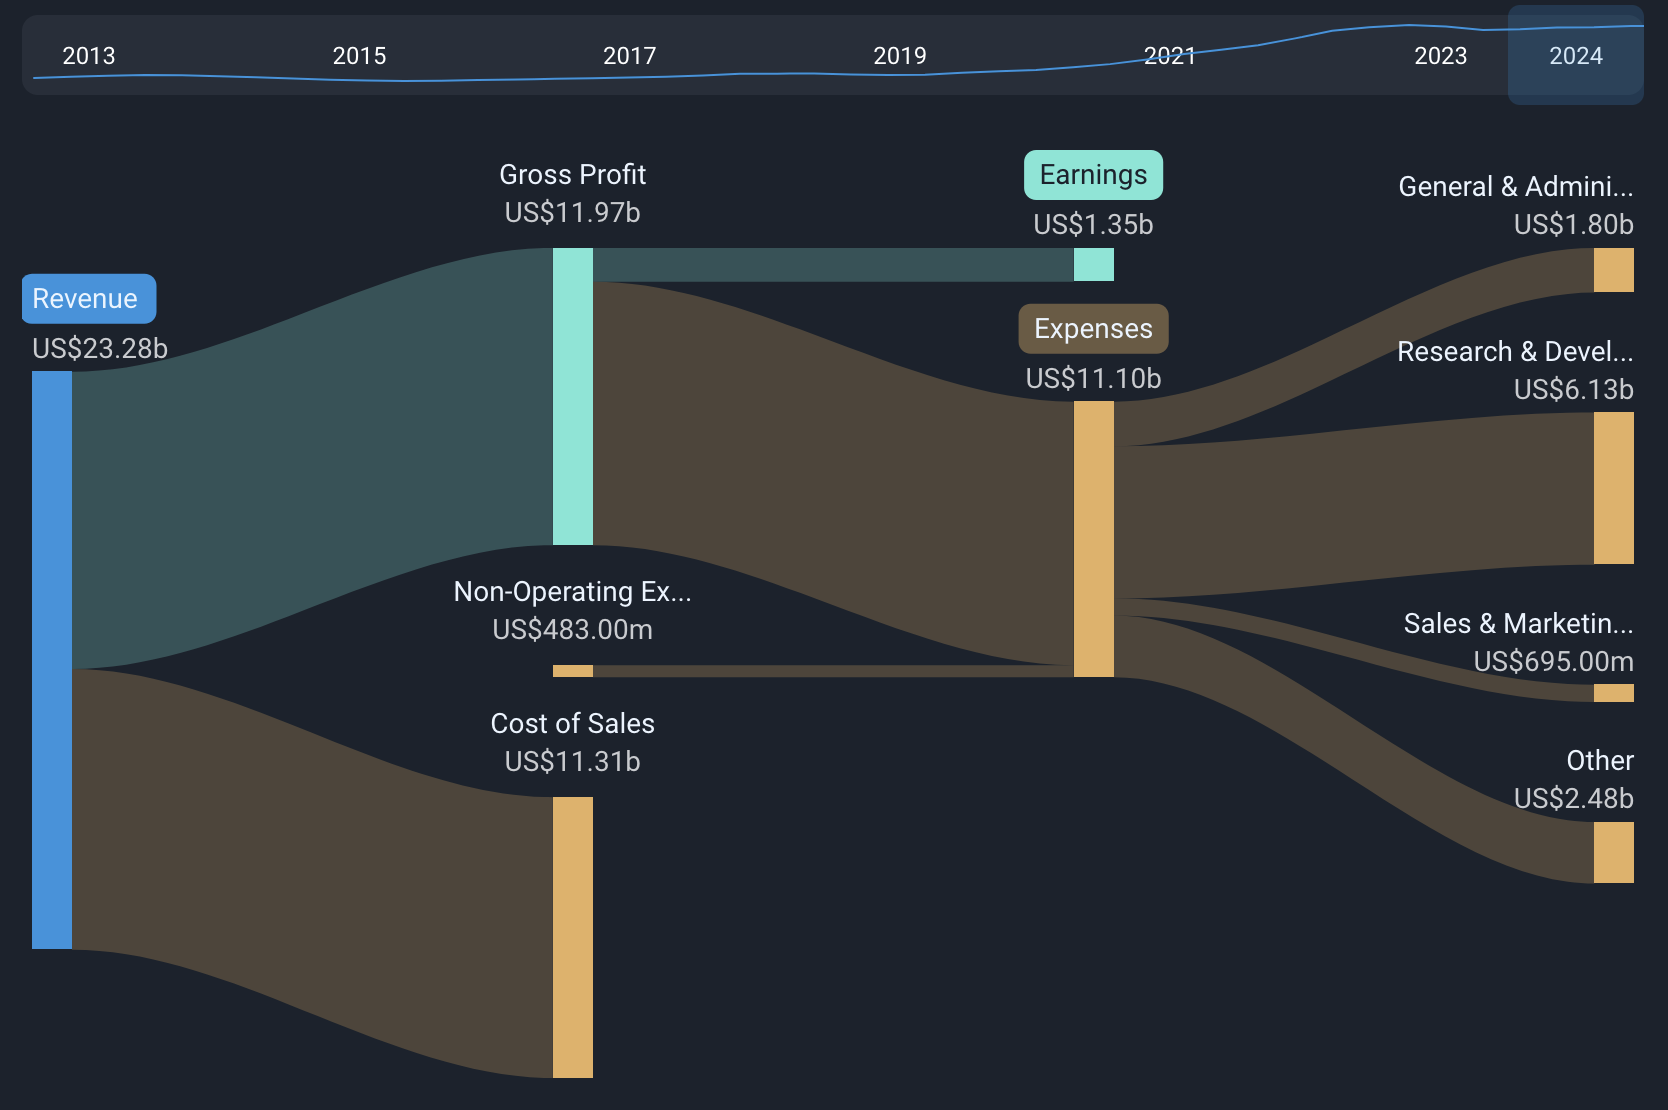
When you’re assessing an individual company, you’ll want to know which markets it serves, and which business segments are contributing to growth and improved margins. The chart below breaks down AMD’s revenue by segment, and can be found in section 3.1 of each company report.
🔎 Tracking Industry Cycles
The semiconductor industry is cyclical, but it differs from other cyclical industries in that it is also very much a growth industry. Growth is closely associated with innovation on the hardware side (i.e. new, better chips) and the application side (i.e. cloud computing, EVs, video games).
Like any cyclical industry, it all comes down to supply and demand:
📈 Demand
The up-leg of a cycle occurs when demand rises faster than supply. This is driven by a combination of innovation and product replacement cycles. At some point you’re going to replace your mobile phone - and you’ll often do that when a model with new or better features is released,
Big cycles are driven by completely new products or application categories - e.g. the PC, the iPhone and generative AI. Successive iPhone models have offered smaller improvements, so those cycles have become less pronounced.
When the manufacturers' products see consumer demand increasing, they will often over-order from their suppliers, including the chipmakers. The chip designers and fabs will then increase capacity to meet increasing demand.
Adding capacity to the supply chain takes months, so increased demand inevitably leads to higher prices and a lot of over ordering. This is when revenue and margins increase.
🏭 Supply
Eventually there will be too much capacity in the supply chain. In addition, companies all the way through the chain build up inventory to avoid being caught off guard. Cycles generally deflate when the entire supply chain is overloaded with investors. This happens at each point in the distribution chain from the retailer to the fabs, and even the companies supplying the fabs.
During the down-leg, everyone wants to get rid of inventory, so prices are discounted and margins fall. This continues until the inventory is drawn down - or any cycle is triggered by a new innovation.
🔎 Monitoring the Cycle
Within the semiconductor industry, several cycles can be occurring at once - but overall sentiment can often be affected by one or two more dramatic trends. To understand what matters to a particular company, you can look at its end markets, its competitors and its suppliers.
In particular, inventory and margins are key metrics to look at, as well as anecdotal comments mentioned during the earnings call. One of the closely watched indicators is equipment billings. The chart below plots the year-on-year change in equipment billings by semiconductor manufacturers against the PHLX index of semiconductor stocks. This index is tracked by the Invesco PHLX Semiconductor ETF .
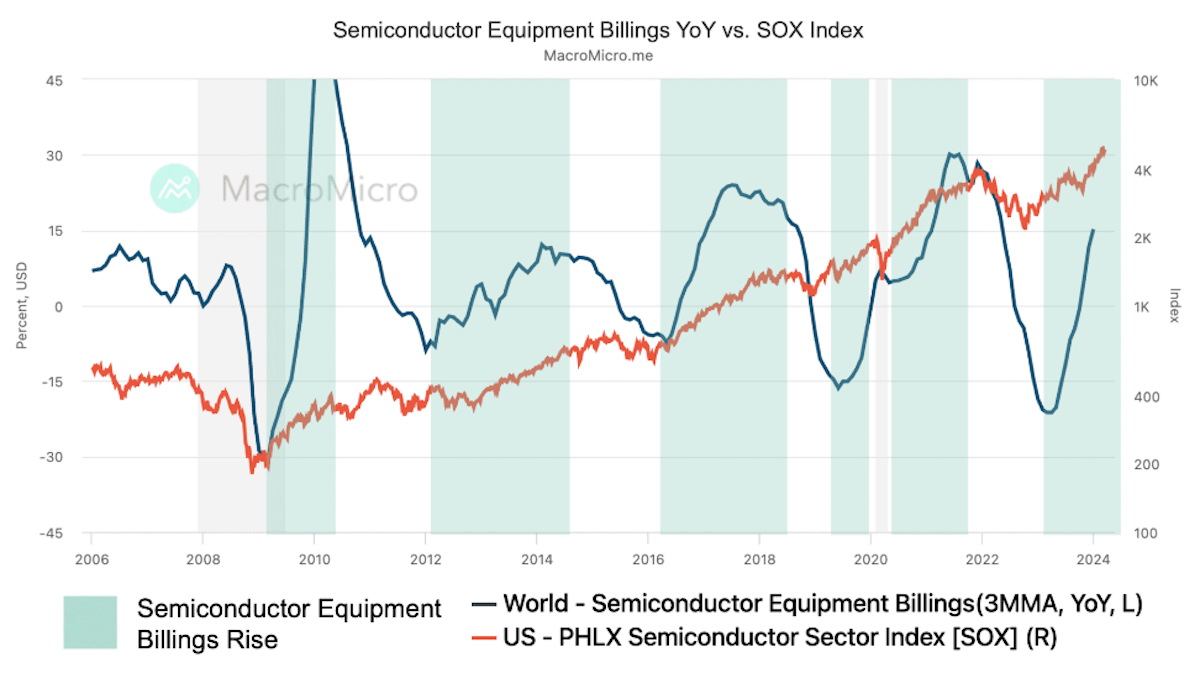
Two excellent resources for equipment billings data as well as other industry data are the
Semiconductor Industry Association (US) and the World Semi Trade Statistics site (global)
💡 The Insight: P/E Ratios Can Tell Us A Bit About The Stages Of Cyclical Industries
For cyclical sectors, the movements of price earnings ratios can be counterintuitive and confusing. P/E ratios will often appear very high when the industry is in a slump, and low after a strong rally.
This is due to the market anticipating the next phase of the cycle. On balance, the market often does quite a good job at anticipating rising and falling earnings, although it often gets it horribly wrong for individual companies.
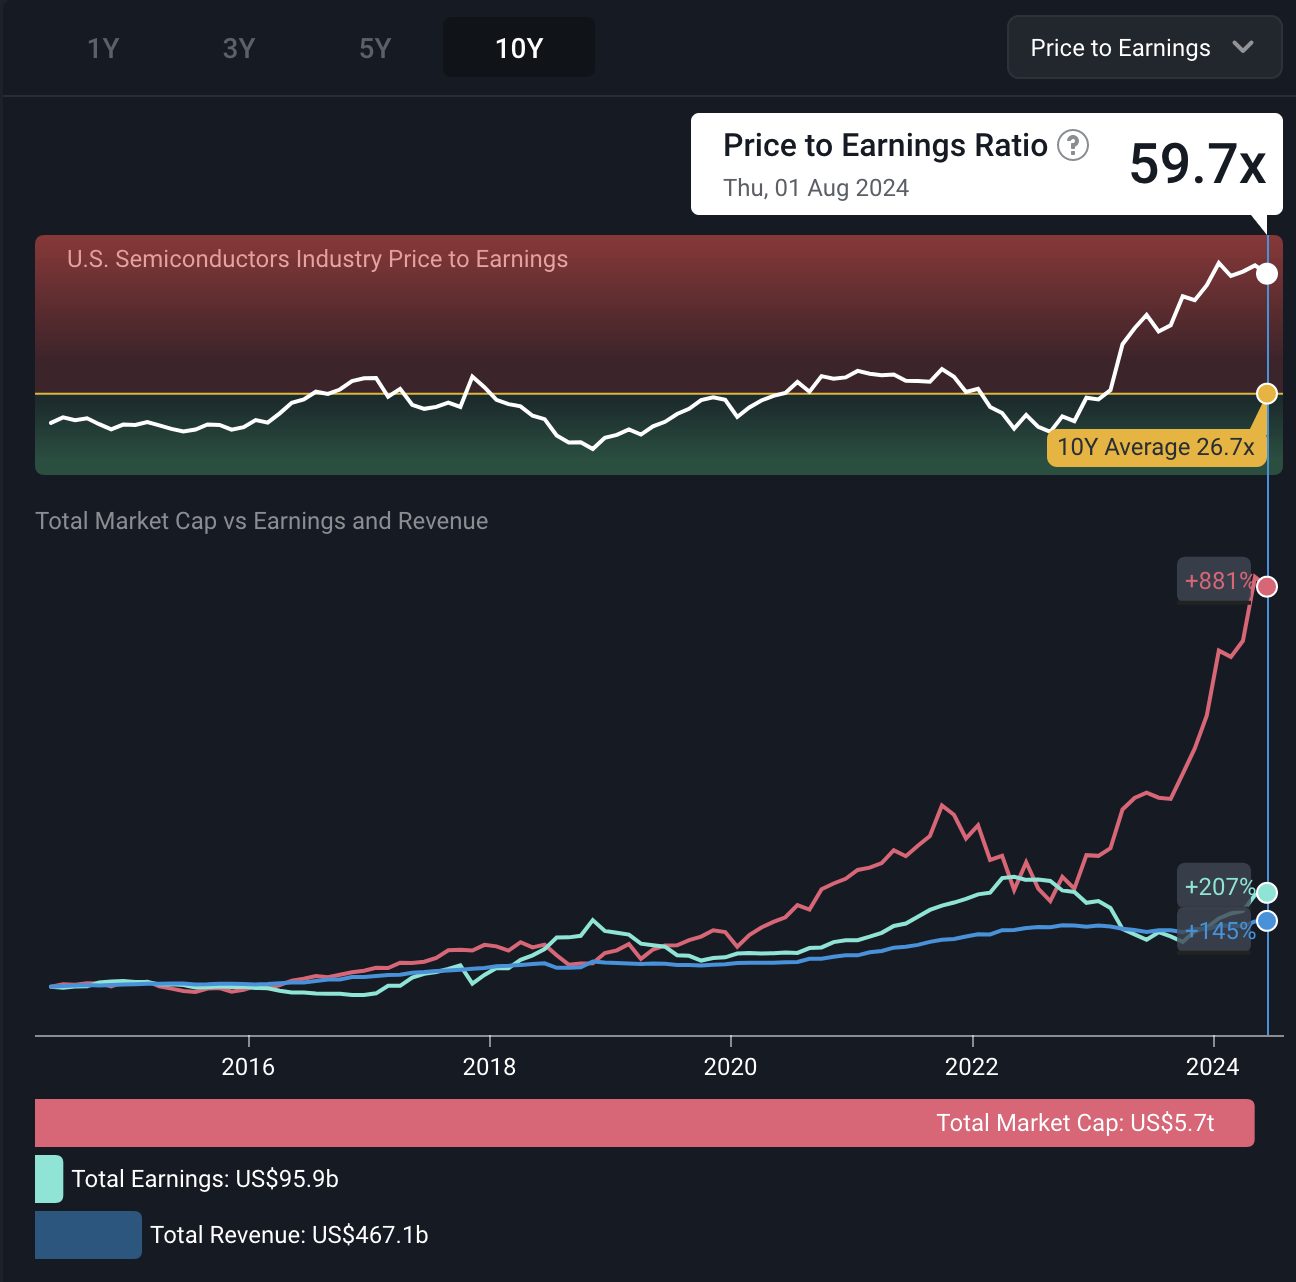
The chart above illustrates the P/E ratio, total market capitalization, revenue and earnings for the US semiconductor industry. Despite a pandemic, a supply chain crunch and an AI driven investment boom, the sector followed a familiar pattern.
- In early 2018 stock prices remained flat while earnings continued to rise. This caused the P/E ratio to fall.
- Later in the year, share prices fell slightly as the market anticipated a peak in earnings. By the time earnings did begin to fall, the market was already anticipating the next cycle, and stock prices were already rising, along with the P/E ratio.
- As earnings growth accelerated in 2020 and 2021 the P/E ratio stopped rising despite share prices continuing to rise.
- In 2022, share prices and the P/E ratio fell before earnings peaked.
- In October 2022, share prices and P/E ratios began to rise as the market anticipated another up-cycle.
- In the last six months, stock prices have continued higher, while P/E ratios have stabilized as earnings have caught up with those price movements.
The key takeaway here is that P/E ratios will often rise dramatically early in a new cycle, and appear to be high a long time before prices peak. P/E ratios can also fall, along with share prices, while earnings continue to rise towards their peak.
In a way, the industry P/E movement can be a leading indicator of market up-cycles and down-cycles, albeit an imperfect one. For individual shares the pattern usually isn’t as clear, but when combined with other elements of the cycle, it can give you an indication of what to expect with respect to earnings and share price.
Key Events During the Next Week
Monday
- 🇺🇸 The US ISM Services Purchasing Managers Index will be published.
Tuesday
- 🇦🇺 The Reserve Bank of Australia will announce its decision on interest rates. Economists expect the benchmark rate to remain at 4.35%.
Wednesday
-
🇩🇪 Germany’s trade data will be published. The trade surplus is expected to narrow slightly to €24 Billion, down slightly from €24.9 Billion.
-
🇨🇦 Canada’s Ivey PMI is forecast to fall from 62.5 to 58.
Thursday
- 🇨🇦 Canada’s trade balance is expected to swing from a CA$1.93 billion deficit to a CA$2.5 billion surplus.
Friday
- 🇨🇳 China’s inflation rate, (currently 0.2%) will be published.
- 🇨🇦 Canada’s unemployment rate (currently 6.4%) will be published.
Second quarter earnings season continues with results due mostly from tech, energy and pharmaceutical companies:
- Berkshire Hathaway
- Walt Disney
- Caterpillar
- Uber
- Shopify
- Airbnb
- Palantir
- Fortinet
- The Trade Desk
- Super Micro Computer
- Datadog
- Duke Energy
- Marathon Petroleum
- Occidental Petroleum
- Eli Lilly
- Amgen
- Gilead Sciences
- Zoetis
- McKesson
- CVS Health
Have feedback on this article? Concerned about the content? Get in touch with us directly. Alternatively, email editorial-team@simplywallst.com
Simply Wall St analyst Richard Bowman and Simply Wall St have no position in any of the companies mentioned. This article is general in nature. We provide commentary based on historical data and analyst forecasts only using an unbiased methodology and our articles are not intended to be financial advice. It does not constitute a recommendation to buy or sell any stock and does not take account of your objectives, or your financial situation. We aim to bring you long-term focused analysis driven by fundamental data. Note that our analysis may not factor in the latest price-sensitive company announcements or qualitative material.
Richard Bowman
Richard is an analyst, writer and investor based in Cape Town, South Africa. He has written for several online investment publications and continues to do so. Richard is fascinated by economics, financial markets and behavioral finance. He is also passionate about tools and content that make investing accessible to everyone.
