Advertisement
- United States
- /
- Insurance
- /
- NYSE:FNF
Does Fidelity National Financial’s Expansion Signal a Value Opportunity After a 6.3% Drop?

Simply Wall St
Reviewed by Bailey Pemberton
- If you find yourself wondering whether Fidelity National Financial is a bargain, you are in good company, and this is the right place to get clear answers.
- While the stock dipped 5.0% over the past month and is down 6.3% over the past year, long-term investors have still seen impressive gains of 104.6% over five years.
- Recent headlines have highlighted Fidelity National Financial's continued expansion in the title insurance space, along with strategic moves that have caught investors’ attention. The market has been watching how these initiatives position the company amid changing economic conditions.
- With a valuation score of 4 out of 6, the company checks many value boxes, but the real story emerges when we dive into both traditional and smart new approaches to valuation. More on those at the end.
Approach 1: Fidelity National Financial Excess Returns Analysis
The Excess Returns valuation model evaluates how effectively a company generates profits over and above its cost of capital. It looks at how much the business earns from its invested equity compared to the minimum return shareholders require. Essentially, is Fidelity National Financial putting its money to work in a way that creates lasting value?
Fidelity National Financial’s book value stands at $29.07 per share, with a stable earnings per share of $3.30. These figures use a median return on equity from the past five years, showing consistent profitability. The cost of equity is calculated at $1.71 per share, which means every year, the company generates $1.59 more per share than it costs to fund its operations. With an average return on equity of 13.07%, Fidelity National Financial is earning well above the usual threshold for value creation. The stable book value, drawn from the past five years, is $25.28 per share, reflecting reliable asset growth.
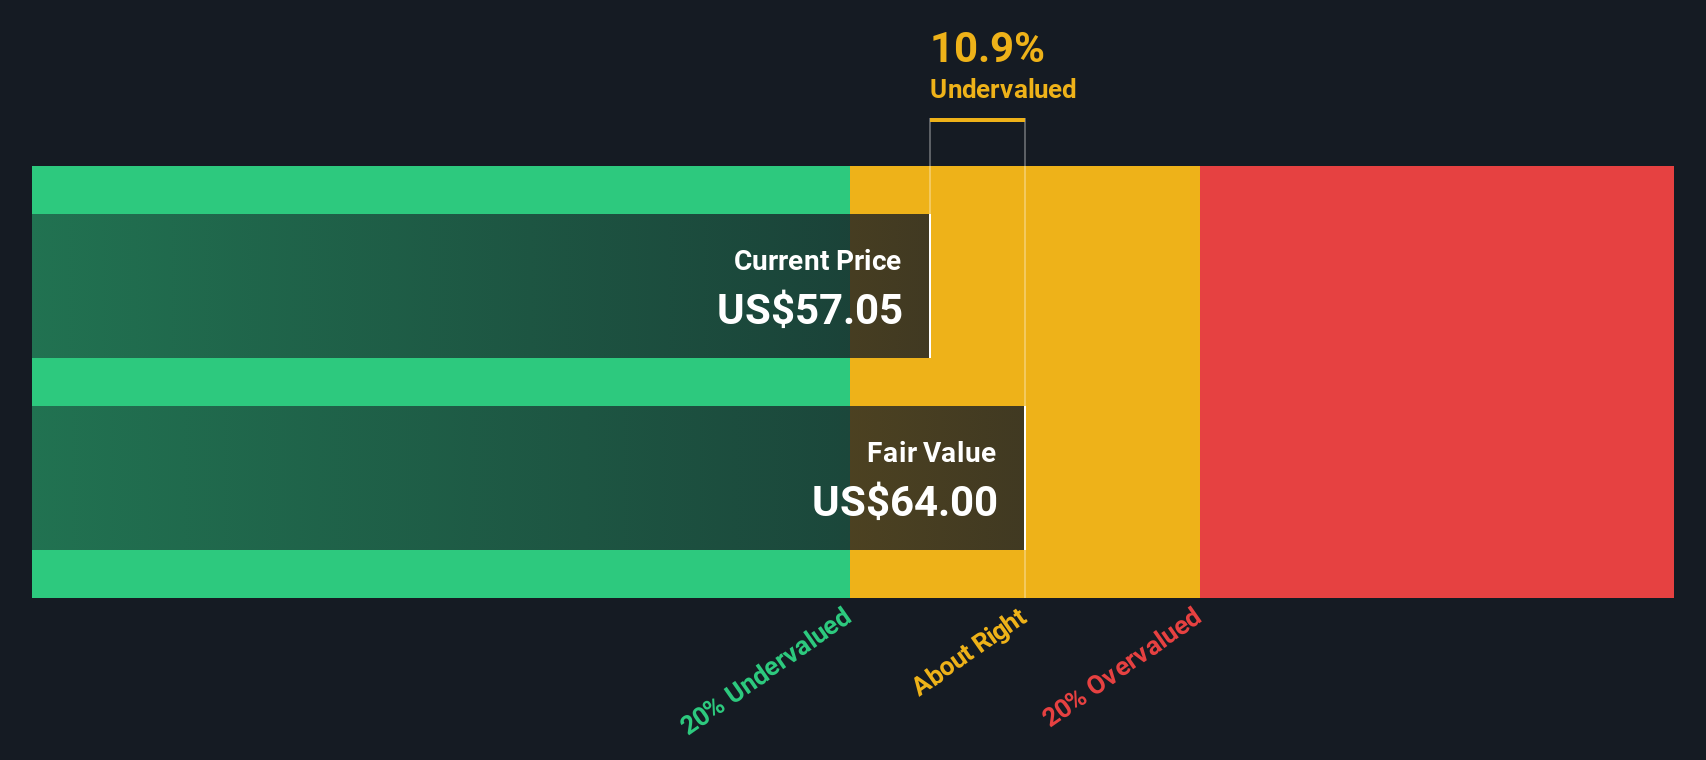
This model results in an estimated intrinsic value that is 19.3% higher than the current share price. This indicates the stock is undervalued relative to its true earning power and capital efficiency.
Result: UNDERVALUED
Our Excess Returns analysis suggests Fidelity National Financial is undervalued by 19.3%. Track this in your watchlist or portfolio, or discover 844 more undervalued stocks based on cash flows.
Approach 2: Fidelity National Financial Price vs Earnings
The Price-to-Earnings (PE) ratio is a time-tested valuation tool, especially relevant for companies with consistent profitability like Fidelity National Financial. The PE ratio connects a company’s current share price to its per-share earnings, providing a direct way to assess how much investors are willing to pay for each dollar of earnings. For profitable companies, this metric is widely used because it captures both expectations about future growth and how much risk investors are willing to take on.
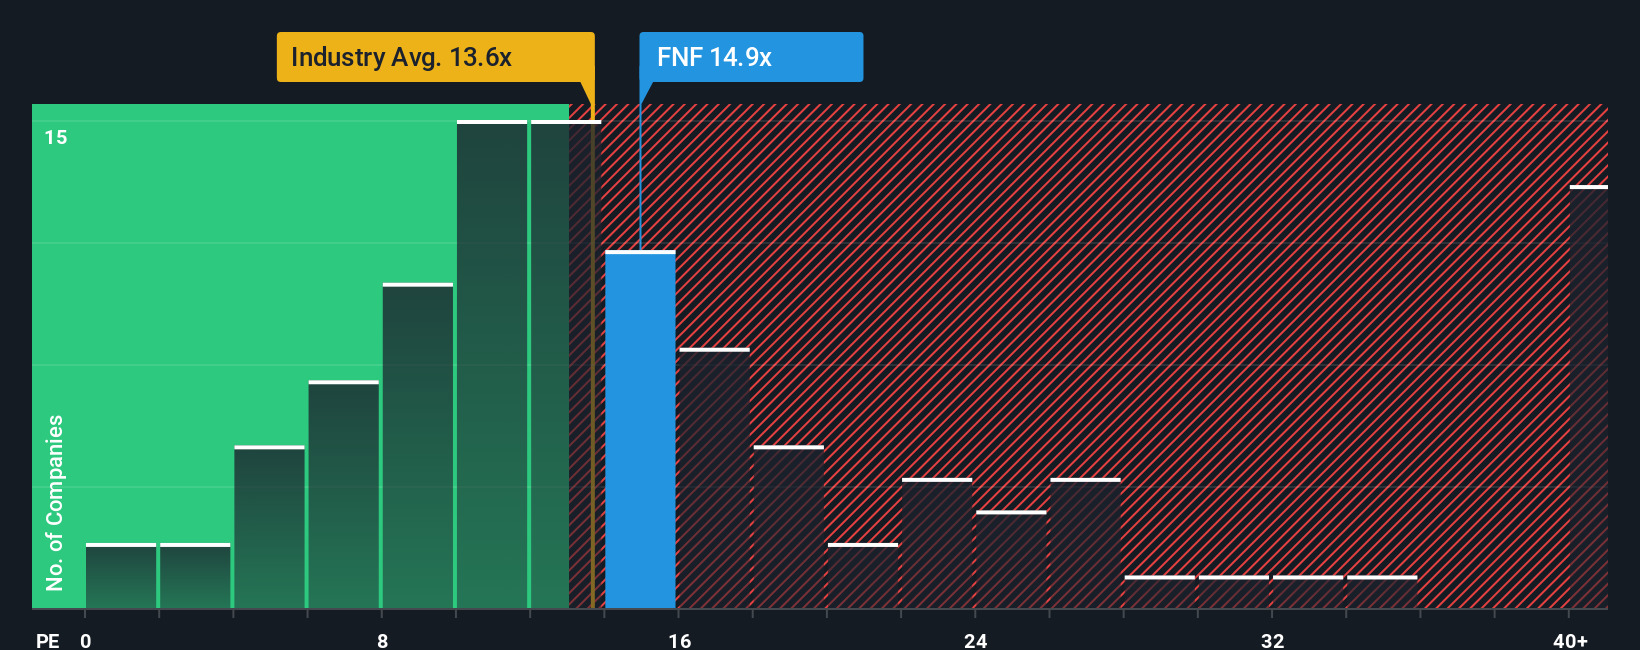
The right PE ratio for a company is shaped by several factors, including its growth prospects, profitability, and the risks it faces. Higher anticipated growth or lower risk usually justifies a higher PE, while economic uncertainties or slower growth typically result in a lower multiple. As of now, Fidelity National Financial trades at a PE ratio of 13.9x, which is very close to the insurance industry average of 13.6x and somewhat below the peer average of 16.4x.
To get a more tailored view, Simply Wall St’s “Fair Ratio” pegs Fidelity National Financial’s appropriate PE at 20.6x. Unlike standard peer or industry comparisons, the Fair Ratio takes into account a comprehensive mix of factors such as the company’s earnings growth, profit margin, risk profile, industry dynamics, and market capitalization. This creates a customized benchmark that captures the nuances often missed by a simple industry average or peer group review.
When we compare Fidelity National Financial’s actual PE ratio of 13.9x with the Fair Ratio of 20.6x, the difference suggests that the stock is undervalued on a PE basis. The company is trading below the multiple that would be expected based on its fundamentals and risk-adjusted growth outlook.
Result: UNDERVALUED
PE ratios tell one story, but what if the real opportunity lies elsewhere? Discover 1407 companies where insiders are betting big on explosive growth.
Upgrade Your Decision Making: Choose your Fidelity National Financial Narrative
Earlier we mentioned that there's an even better way to understand valuation, so let's introduce you to Narratives. A Narrative is simply the story or perspective you have on a company, connecting your views about its business, future growth, and risks with your best estimate of its fair value, revenue, earnings, and margins.
Unlike static numbers, Narratives wrap your assumptions, research, and reasoning into a single, easy-to-update picture that ties Fidelity National Financial’s broader business context directly to the actual financial forecast and your fair value, all in one place.
This approach is accessible to anyone using Simply Wall St’s Community page, where millions of investors share, compare, and update their Narratives as markets shift and news breaks. By comparing your fair value to the current price, you can quickly decide whether the stock fits your own criteria to buy, hold, or sell.
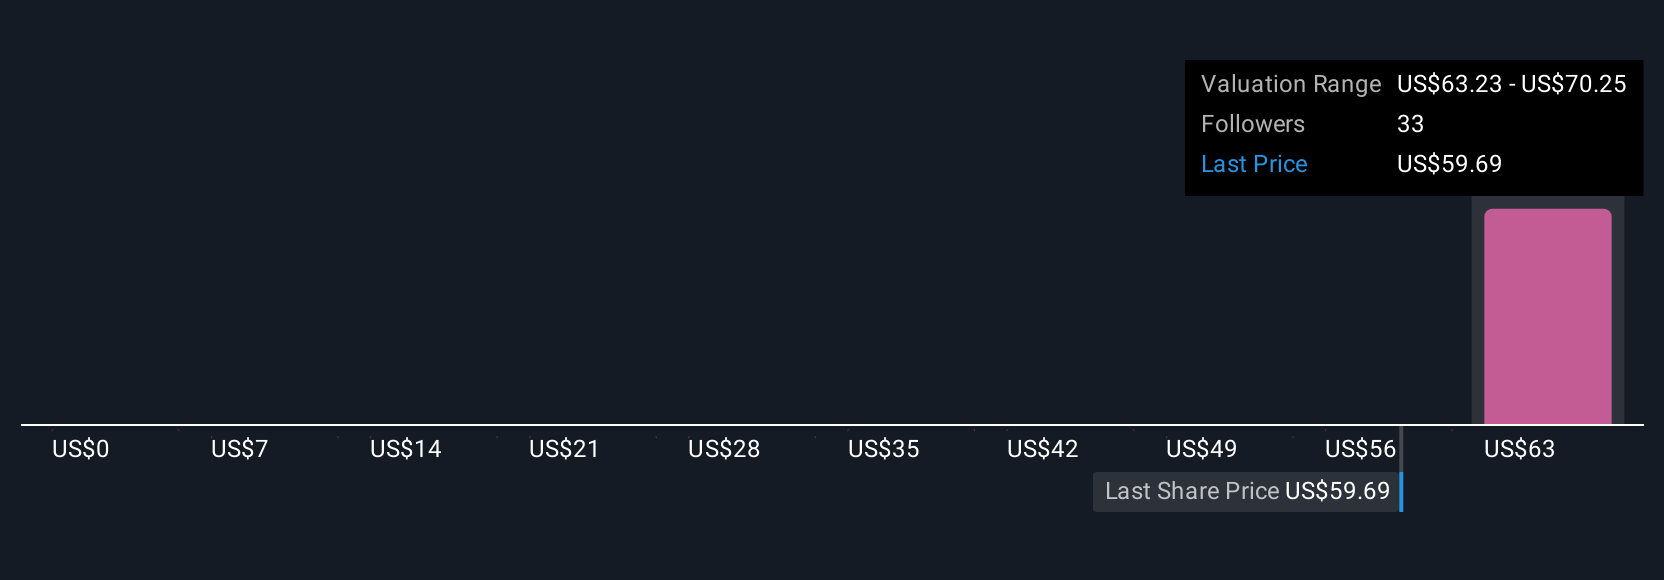
What’s more, Narratives adapt in real-time as earnings reports or industry news emerge, providing a live feed for your investment thesis. For example, some investors might see rising revenues and digital investments as a catalyst for a $70.25 fair value, while others might focus on industry risks and forecast a more conservative $59.97. This demonstrates how Narratives help you make a fully informed, personalized investment decision.
Do you think there's more to the story for Fidelity National Financial? Head over to our Community to see what others are saying!
This article by Simply Wall St is general in nature. We provide commentary based on historical data and analyst forecasts only using an unbiased methodology and our articles are not intended to be financial advice. It does not constitute a recommendation to buy or sell any stock, and does not take account of your objectives, or your financial situation. We aim to bring you long-term focused analysis driven by fundamental data. Note that our analysis may not factor in the latest price-sensitive company announcements or qualitative material. Simply Wall St has no position in any stocks mentioned.
New: AI Stock Screener & Alerts
Our new AI Stock Screener scans the market every day to uncover opportunities.
• Dividend Powerhouses (3%+ Yield)
• Undervalued Small Caps with Insider Buying
• High growth Tech and AI Companies
Or build your own from over 50 metrics.
Have feedback on this article? Concerned about the content? Get in touch with us directly. Alternatively, email editorial-team@simplywallst.com
About NYSE:FNF
Fidelity National Financial
Provides various insurance products in the United States.
Established dividend payer and good value.
Similar Companies
Market Insights

Advertisement
Community Narratives
The company that turned a verb into a global necessity and basically runs the modern internet, digital ads, smartphones, maps, and AI.
Fair Value US$300.00|5.2% undervalued
OS
Community Contributor
Flowers Foods Pays A Fair Price For Health
Fair Value US$16.12|24.9% undervalued
NV
Community Contributor
TMX Group will thrive with 33.3% profit margin and enduring market moat
Fair Value CA$49.90|3.3% overvalued
LI
Community Contributor
The "Molecular Pencil": Why Beam's Technology is Built to Win
Fair Value US$65.01|64.5% undervalued
DA
Community Contributor