
Advertisement

This article is for investors who would like to improve their understanding of price to earnings ratios (P/E ratios). We'll look at Aflac Incorporated's (NYSE:AFL) P/E ratio and reflect on what it tells us about the company's share price. Based on the last twelve months, Aflac's P/E ratio is 13.13. That is equivalent to an earnings yield of about 7.6%.
Check out our latest analysis for Aflac
How Do I Calculate Aflac's Price To Earnings Ratio?
The formula for P/E is:
Price to Earnings Ratio = Price per Share ÷ Earnings per Share (EPS)
Or for Aflac:
P/E of 13.13 = $49.83 ÷ $3.79 (Based on the year to December 2018.)
Is A High P/E Ratio Good?
A higher P/E ratio implies that investors pay a higher price for the earning power of the business. That isn't necessarily good or bad, but a high P/E implies relatively high expectations of what a company can achieve in the future.
How Growth Rates Impact P/E Ratios
P/E ratios primarily reflect market expectations around earnings growth rates. That's because companies that grow earnings per share quickly will rapidly increase the 'E' in the equation. That means even if the current P/E is high, it will reduce over time if the share price stays flat. So while a stock may look expensive based on past earnings, it could be cheap based on future earnings.
Aflac shrunk earnings per share by 35% over the last year. But over the longer term (5 years) earnings per share have increased by 13%.
How Does Aflac's P/E Ratio Compare To Its Peers?
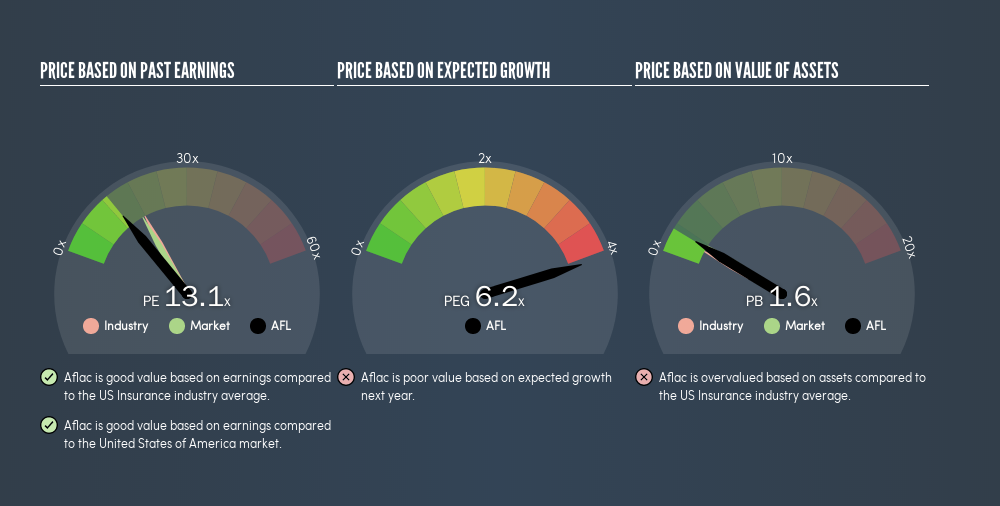
We can get an indication of market expectations by looking at the P/E ratio. We can see in the image below that the average P/E (18.1) for companies in the insurance industry is higher than Aflac's P/E.
Aflac's P/E tells us that market participants think it will not fare as well as its peers in the same industry. Many investors like to buy stocks when the market is pessimistic about their prospects. It is arguably worth checking if insiders are buying shares, because that might imply they believe the stock is undervalued.
Don't Forget: The P/E Does Not Account For Debt or Bank Deposits
The 'Price' in P/E reflects the market capitalization of the company. Thus, the metric does not reflect cash or debt held by the company. Hypothetically, a company could reduce its future P/E ratio by spending its cash (or taking on debt) to achieve higher earnings.
Such spending might be good or bad, overall, but the key point here is that you need to look at debt to understand the P/E ratio in context.
How Does Aflac's Debt Impact Its P/E Ratio?
Aflac has net debt worth just 6.3% of its market capitalization. The market might award it a higher P/E ratio if it had net cash, but its unlikely this low level of net borrowing is having a big impact on the P/E multiple.
The Verdict On Aflac's P/E Ratio
Aflac trades on a P/E ratio of 13.1, which is below the US market average of 17.3. The debt levels are not a major concern, but the lack of EPS growth is likely weighing on sentiment.
Investors have an opportunity when market expectations about a stock are wrong. As value investor Benjamin Graham famously said, 'In the short run, the market is a voting machine but in the long run, it is a weighing machine.' So this freevisual report on analyst forecasts could hold the key to an excellent investment decision.
You might be able to find a better buy than Aflac. If you want a selection of possible winners, check out this freelist of interesting companies that trade on a P/E below 20 (but have proven they can grow earnings).
We aim to bring you long-term focused research analysis driven by fundamental data. Note that our analysis may not factor in the latest price-sensitive company announcements or qualitative material.
If you spot an error that warrants correction, please contact the editor at editorial-team@simplywallst.com. This article by Simply Wall St is general in nature. It does not constitute a recommendation to buy or sell any stock, and does not take account of your objectives, or your financial situation. Simply Wall St has no position in the stocks mentioned. Thank you for reading.
About NYSE:AFL
Aflac
Through its subsidiaries, provides supplemental health and life insurance products.
Established dividend payer with adequate balance sheet.
Similar Companies
Market Insights


Advertisement
Community Narratives
The Future of Drug Testing? Fingerprint Tech Shows Serious Promise
Fair Value US$2.98|40.3% undervalued
JO
Community Contributor
Suncorp’s Next Chapter: Insurance-Only and Ready to Grow
Fair Value AU$22.83|7.9% undervalued
RO
Community Contributor
Thyssenkrupp Nucera Will Achieve Double-Digit Profits by 2030 Boosted by Hydrogen Growth
Fair Value €14.40|31.6% undervalued
CH
Community Contributor
Tesla’s Nvidia Moment – The AI & Robotics Inflection Point
Fair Value US$359.72|12.3% undervalued
BL
Community Contributor