- United States
- /
- Insurance
- /
- NasdaqCM:RELI
Introducing Reliance Global Group (NASDAQ:RELI), The Stock That Soared 936% In The Last Three Years
It hasn't been the best quarter for Reliance Global Group, Inc. (NASDAQ:RELI) shareholders, since the share price has fallen 19% in that time. But that doesn't displace its brilliant performance over three years. The longer term view reveals that the share price is up 936% in that period. So the recent fall doesn't do much to dampen our respect for the business. The share price action could signify that the business itself is dramatically improved, in that time.
It really delights us to see such great share price performance for investors.
View our latest analysis for Reliance Global Group
Given that Reliance Global Group didn't make a profit in the last twelve months, we'll focus on revenue growth to form a quick view of its business development. Shareholders of unprofitable companies usually expect strong revenue growth. That's because it's hard to be confident a company will be sustainable if revenue growth is negligible, and it never makes a profit.
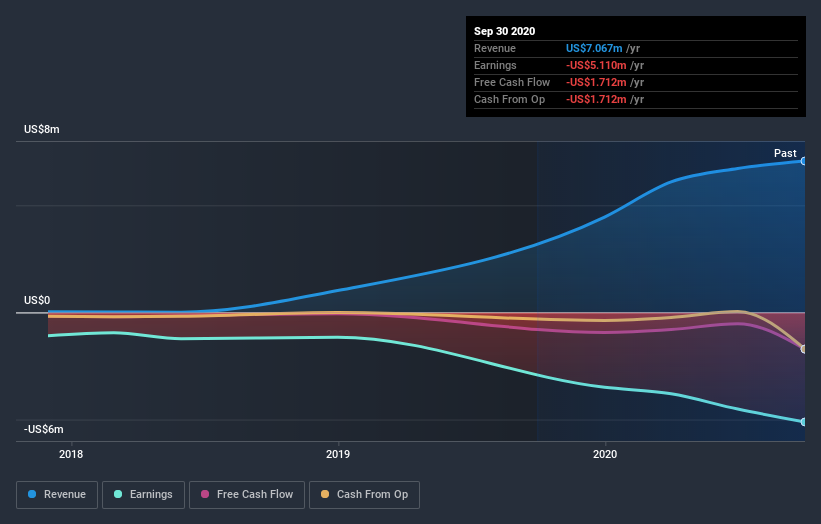
Reliance Global Group's revenue trended up 91% each year over three years. That's well above most pre-profit companies. In light of this attractive revenue growth, it seems somewhat appropriate that the share price has been rocketing, boasting a gain of 118% per year, over the same period. It's always tempting to take profits after a share price gain like that, but high-growth companies like Reliance Global Group can sometimes sustain strong growth for many years. So we'd recommend you take a closer look at this one, or even put it on your watchlist.
You can see below how earnings and revenue have changed over time (discover the exact values by clicking on the image).

It's probably worth noting that the CEO is paid less than the median at similar sized companies. But while CEO remuneration is always worth checking, the really important question is whether the company can grow earnings going forward. Dive deeper into the earnings by checking this interactive graph of Reliance Global Group's earnings, revenue and cash flow.
A Different Perspective
Reliance Global Group shareholders are down 90% for the year, but the market itself is up 40%. Even the share prices of good stocks drop sometimes, but we want to see improvements in the fundamental metrics of a business, before getting too interested. Regrettably, last year's performance caps off a bad run, with the shareholders facing a total loss of 14% per year over five years. Generally speaking long term share price weakness can be a bad sign, though contrarian investors might want to research the stock in hope of a turnaround. It's always interesting to track share price performance over the longer term. But to understand Reliance Global Group better, we need to consider many other factors. To that end, you should learn about the 5 warning signs we've spotted with Reliance Global Group (including 3 which shouldn't be ignored) .
If you are like me, then you will not want to miss this free list of growing companies that insiders are buying.
Please note, the market returns quoted in this article reflect the market weighted average returns of stocks that currently trade on US exchanges.
If you decide to trade Reliance Global Group, use the lowest-cost* platform that is rated #1 Overall by Barron’s, Interactive Brokers. Trade stocks, options, futures, forex, bonds and funds on 135 markets, all from a single integrated account. Promoted
New: AI Stock Screener & Alerts
Our new AI Stock Screener scans the market every day to uncover opportunities.
• Dividend Powerhouses (3%+ Yield)
• Undervalued Small Caps with Insider Buying
• High growth Tech and AI Companies
Or build your own from over 50 metrics.
This article by Simply Wall St is general in nature. It does not constitute a recommendation to buy or sell any stock, and does not take account of your objectives, or your financial situation. We aim to bring you long-term focused analysis driven by fundamental data. Note that our analysis may not factor in the latest price-sensitive company announcements or qualitative material. Simply Wall St has no position in any stocks mentioned.
*Interactive Brokers Rated Lowest Cost Broker by StockBrokers.com Annual Online Review 2020
Have feedback on this article? Concerned about the content? Get in touch with us directly. Alternatively, email editorial-team (at) simplywallst.com.
About NasdaqCM:RELI
Reliance Global Group
Focuses on the acquisition and management of wholesale and retail insurance agencies in the United States.
Adequate balance sheet with slight risk.
Market Insights
Community Narratives


