- United States
- /
- Household Products
- /
- NYSE:PG
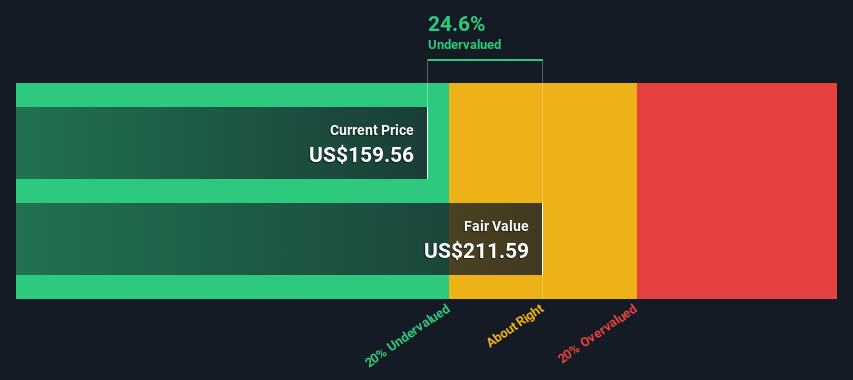
An Intrinsic Calculation For The Procter & Gamble Company (NYSE:PG) Suggests It's 25% Undervalued

Key Insights
- Procter & Gamble's estimated fair value is US$212 based on 2 Stage Free Cash Flow to Equity
- Procter & Gamble's US$160 share price signals that it might be 25% undervalued
- Our fair value estimate is 26% higher than Procter & Gamble's analyst price target of US$168
Today we'll do a simple run through of a valuation method used to estimate the attractiveness of The Procter & Gamble Company (NYSE:PG) as an investment opportunity by taking the expected future cash flows and discounting them to their present value. We will take advantage of the Discounted Cash Flow (DCF) model for this purpose. Don't get put off by the jargon, the math behind it is actually quite straightforward.
We generally believe that a company's value is the present value of all of the cash it will generate in the future. However, a DCF is just one valuation metric among many, and it is not without flaws. For those who are keen learners of equity analysis, the Simply Wall St analysis model here may be something of interest to you.
View our latest analysis for Procter & Gamble
The Model
We're using the 2-stage growth model, which simply means we take in account two stages of company's growth. In the initial period the company may have a higher growth rate and the second stage is usually assumed to have a stable growth rate. To begin with, we have to get estimates of the next ten years of cash flows. Where possible we use analyst estimates, but when these aren't available we extrapolate the previous free cash flow (FCF) from the last estimate or reported value. We assume companies with shrinking free cash flow will slow their rate of shrinkage, and that companies with growing free cash flow will see their growth rate slow, over this period. We do this to reflect that growth tends to slow more in the early years than it does in later years.
Generally we assume that a dollar today is more valuable than a dollar in the future, so we discount the value of these future cash flows to their estimated value in today's dollars:
10-year free cash flow (FCF) estimate
| 2024 | 2025 | 2026 | 2027 | 2028 | 2029 | 2030 | 2031 | 2032 | 2033 | |
| Levered FCF ($, Millions) | US$15.9b | US$16.7b | US$17.7b | US$18.4b | US$19.5b | US$20.3b | US$21.0b | US$21.6b | US$22.3b | US$22.9b |
| Growth Rate Estimate Source | Analyst x8 | Analyst x8 | Analyst x6 | Analyst x2 | Analyst x2 | Est @ 4.10% | Est @ 3.56% | Est @ 3.18% | Est @ 2.91% | Est @ 2.73% |
| Present Value ($, Millions) Discounted @ 6.0% | US$15.0k | US$14.8k | US$14.8k | US$14.6k | US$14.6k | US$14.3k | US$14.0k | US$13.6k | US$13.2k | US$12.8k |
("Est" = FCF growth rate estimated by Simply Wall St)
Present Value of 10-year Cash Flow (PVCF) = US$142b
After calculating the present value of future cash flows in the initial 10-year period, we need to calculate the Terminal Value, which accounts for all future cash flows beyond the first stage. The Gordon Growth formula is used to calculate Terminal Value at a future annual growth rate equal to the 5-year average of the 10-year government bond yield of 2.3%. We discount the terminal cash flows to today's value at a cost of equity of 6.0%.
Terminal Value (TV)= FCF2033 × (1 + g) ÷ (r – g) = US$23b× (1 + 2.3%) ÷ (6.0%– 2.3%) = US$636b
Present Value of Terminal Value (PVTV)= TV / (1 + r)10= US$636b÷ ( 1 + 6.0%)10= US$356b
The total value is the sum of cash flows for the next ten years plus the discounted terminal value, which results in the Total Equity Value, which in this case is US$498b. The last step is to then divide the equity value by the number of shares outstanding. Compared to the current share price of US$160, the company appears a touch undervalued at a 25% discount to where the stock price trades currently. Valuations are imprecise instruments though, rather like a telescope - move a few degrees and end up in a different galaxy. Do keep this in mind.
The Assumptions
We would point out that the most important inputs to a discounted cash flow are the discount rate and of course the actual cash flows. If you don't agree with these result, have a go at the calculation yourself and play with the assumptions. The DCF also does not consider the possible cyclicality of an industry, or a company's future capital requirements, so it does not give a full picture of a company's potential performance. Given that we are looking at Procter & Gamble as potential shareholders, the cost of equity is used as the discount rate, rather than the cost of capital (or weighted average cost of capital, WACC) which accounts for debt. In this calculation we've used 6.0%, which is based on a levered beta of 0.800. Beta is a measure of a stock's volatility, compared to the market as a whole. We get our beta from the industry average beta of globally comparable companies, with an imposed limit between 0.8 and 2.0, which is a reasonable range for a stable business.
SWOT Analysis for Procter & Gamble
- Debt is well covered by earnings and cashflows.
- Dividends are covered by earnings and cash flows.
- Earnings growth over the past year underperformed the Household Products industry.
- Dividend is low compared to the top 25% of dividend payers in the Household Products market.
- Annual earnings are forecast to grow for the next 3 years.
- Good value based on P/E ratio and estimated fair value.
- Annual earnings are forecast to grow slower than the American market.
Next Steps:
Although the valuation of a company is important, it ideally won't be the sole piece of analysis you scrutinize for a company. The DCF model is not a perfect stock valuation tool. Instead the best use for a DCF model is to test certain assumptions and theories to see if they would lead to the company being undervalued or overvalued. For example, changes in the company's cost of equity or the risk free rate can significantly impact the valuation. Can we work out why the company is trading at a discount to intrinsic value? For Procter & Gamble, we've compiled three important items you should look at:
- Risks: Case in point, we've spotted 2 warning signs for Procter & Gamble you should be aware of.
- Management:Have insiders been ramping up their shares to take advantage of the market's sentiment for PG's future outlook? Check out our management and board analysis with insights on CEO compensation and governance factors.
- Other High Quality Alternatives: Do you like a good all-rounder? Explore our interactive list of high quality stocks to get an idea of what else is out there you may be missing!
PS. Simply Wall St updates its DCF calculation for every American stock every day, so if you want to find the intrinsic value of any other stock just search here.
New: Manage All Your Stock Portfolios in One Place
We've created the ultimate portfolio companion for stock investors, and it's free.
• Connect an unlimited number of Portfolios and see your total in one currency
• Be alerted to new Warning Signs or Risks via email or mobile
• Track the Fair Value of your stocks
Have feedback on this article? Concerned about the content? Get in touch with us directly. Alternatively, email editorial-team (at) simplywallst.com.
This article by Simply Wall St is general in nature. We provide commentary based on historical data and analyst forecasts only using an unbiased methodology and our articles are not intended to be financial advice. It does not constitute a recommendation to buy or sell any stock, and does not take account of your objectives, or your financial situation. We aim to bring you long-term focused analysis driven by fundamental data. Note that our analysis may not factor in the latest price-sensitive company announcements or qualitative material. Simply Wall St has no position in any stocks mentioned.
About NYSE:PG
Procter & Gamble
Engages in the provision of branded consumer packaged goods worldwide.
Solid track record established dividend payer.
Similar Companies
Market Insights

Community Narratives

