

Warren Buffett famously said, 'Volatility is far from synonymous with risk.' So it seems the smart money knows that debt - which is usually involved in bankruptcies - is a very important factor, when you assess how risky a company is. We note that Teleflex Incorporated (NYSE:TFX) does have debt on its balance sheet. But should shareholders be worried about its use of debt?
What Risk Does Debt Bring?
Debt assists a business until the business has trouble paying it off, either with new capital or with free cash flow. In the worst case scenario, a company can go bankrupt if it cannot pay its creditors. However, a more common (but still painful) scenario is that it has to raise new equity capital at a low price, thus permanently diluting shareholders. By replacing dilution, though, debt can be an extremely good tool for businesses that need capital to invest in growth at high rates of return. When we examine debt levels, we first consider both cash and debt levels, together.
Check out our latest analysis for Teleflex
What Is Teleflex's Net Debt?
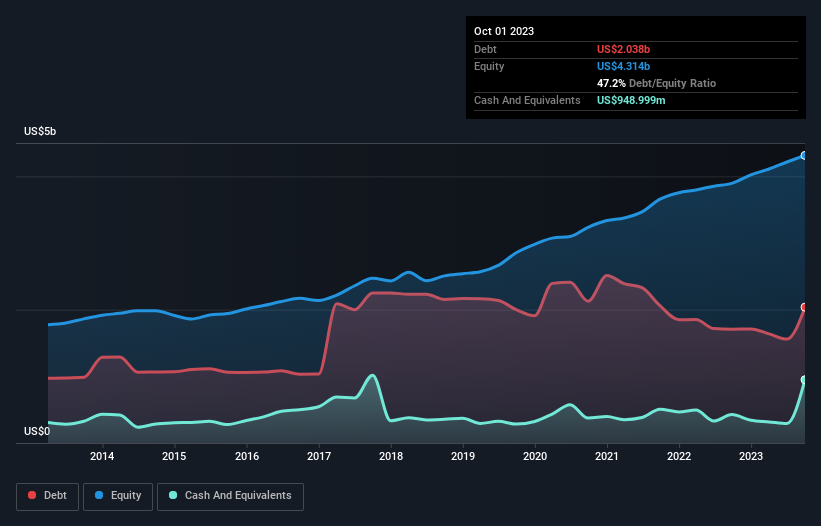
The image below, which you can click on for greater detail, shows that at October 2023 Teleflex had debt of US$2.04b, up from US$1.71b in one year. However, it also had US$949.0m in cash, and so its net debt is US$1.09b.
A Look At Teleflex's Liabilities
The latest balance sheet data shows that Teleflex had liabilities of US$585.4m due within a year, and liabilities of US$2.59b falling due after that. On the other hand, it had cash of US$949.0m and US$425.2m worth of receivables due within a year. So it has liabilities totalling US$1.81b more than its cash and near-term receivables, combined.
Of course, Teleflex has a titanic market capitalization of US$11.6b, so these liabilities are probably manageable. But there are sufficient liabilities that we would certainly recommend shareholders continue to monitor the balance sheet, going forward.
We use two main ratios to inform us about debt levels relative to earnings. The first is net debt divided by earnings before interest, tax, depreciation, and amortization (EBITDA), while the second is how many times its earnings before interest and tax (EBIT) covers its interest expense (or its interest cover, for short). The advantage of this approach is that we take into account both the absolute quantum of debt (with net debt to EBITDA) and the actual interest expenses associated with that debt (with its interest cover ratio).
Teleflex has net debt of just 1.3 times EBITDA, indicating that it is certainly not a reckless borrower. And this view is supported by the solid interest coverage, with EBIT coming in at 8.3 times the interest expense over the last year. Fortunately, Teleflex grew its EBIT by 9.6% in the last year, making that debt load look even more manageable. When analysing debt levels, the balance sheet is the obvious place to start. But ultimately the future profitability of the business will decide if Teleflex can strengthen its balance sheet over time. So if you want to see what the professionals think, you might find this free report on analyst profit forecasts to be interesting.
But our final consideration is also important, because a company cannot pay debt with paper profits; it needs cold hard cash. So it's worth checking how much of that EBIT is backed by free cash flow. Over the most recent three years, Teleflex recorded free cash flow worth 80% of its EBIT, which is around normal, given free cash flow excludes interest and tax. This free cash flow puts the company in a good position to pay down debt, when appropriate.
Our View
Happily, Teleflex's impressive conversion of EBIT to free cash flow implies it has the upper hand on its debt. And its interest cover is good too. We would also note that Medical Equipment industry companies like Teleflex commonly do use debt without problems. Zooming out, Teleflex seems to use debt quite reasonably; and that gets the nod from us. While debt does bring risk, when used wisely it can also bring a higher return on equity. Above most other metrics, we think its important to track how fast earnings per share is growing, if at all. If you've also come to that realization, you're in luck, because today you can view this interactive graph of Teleflex's earnings per share history for free.
Of course, if you're the type of investor who prefers buying stocks without the burden of debt, then don't hesitate to discover our exclusive list of net cash growth stocks, today.
If you're looking to trade Teleflex, open an account with the lowest-cost platform trusted by professionals, Interactive Brokers.
With clients in over 200 countries and territories, and access to 160 markets, IBKR lets you trade stocks, options, futures, forex, bonds and funds from a single integrated account.
Enjoy no hidden fees, no account minimums, and FX conversion rates as low as 0.03%, far better than what most brokers offer.
Sponsored ContentValuation is complex, but we're here to simplify it.
Discover if Teleflex might be undervalued or overvalued with our detailed analysis, featuring fair value estimates, potential risks, dividends, insider trades, and its financial condition.
Access Free AnalysisHave feedback on this article? Concerned about the content? Get in touch with us directly. Alternatively, email editorial-team (at) simplywallst.com.
This article by Simply Wall St is general in nature. We provide commentary based on historical data and analyst forecasts only using an unbiased methodology and our articles are not intended to be financial advice. It does not constitute a recommendation to buy or sell any stock, and does not take account of your objectives, or your financial situation. We aim to bring you long-term focused analysis driven by fundamental data. Note that our analysis may not factor in the latest price-sensitive company announcements or qualitative material. Simply Wall St has no position in any stocks mentioned.
About NYSE:TFX
Teleflex
Designs, develops, manufactures, and supplies single-use medical devices for common diagnostic and therapeutic procedures in critical care and surgical applications worldwide.
Excellent balance sheet with moderate growth potential.

