Advertisement
- United States
- /
- Healthcare Services
- /
- NYSE:PACS
PACS Group (NYSE:PACS) Valuation in Focus After NYSE Extension and Leadership Changes

Simply Wall St
Reviewed by Kshitija Bhandaru
PACS Group (NYSE:PACS) has found itself in the spotlight after the New York Stock Exchange granted an extension to address financial restatements. At the same time, the company is navigating leadership changes and continues to report record operational performance for 2025.
See our latest analysis for PACS Group.
Amid all the governance updates and regulatory hurdles, investor interest in PACS Group has stayed steady, with the 1-year total shareholder return down just 0.6%. The company’s steady operational performance and expansion plans appear to be supporting positive sentiment, even as the stock consolidates. At the same time, momentum is building around future growth prospects.
If these kinds of resilient turnarounds have you searching for more, now might be the perfect moment to uncover opportunities with fast growing stocks with high insider ownership
With analysts projecting over 150 percent upside and the company showing robust growth despite recent hurdles, the question remains: Is PACS Group’s true value yet to be recognized by the market, or is future growth already priced in?
Price-to-Earnings of 23x: Is it justified?
PACS Group’s current market price reflects a price-to-earnings (P/E) multiple of 23x, which is above both industry and peer averages. This higher valuation often signals that investors expect strong future earnings growth. Does the company’s growth outlook support paying such a premium?
The price-to-earnings ratio measures how much investors are willing to pay for each dollar of the company’s current earnings. In healthcare, an elevated P/E typically implies confidence in ongoing profit expansion, scalable business models, or significant future catalysts.
However, PACS trades at a premium to the US Healthcare industry average of 21.4x and the peer average of 15.4x. This indicates the market may be pricing in considerable optimism. Despite this, the stock’s P/E remains lower than the estimated fair P/E of 65.2x, suggesting headroom for upward re-rating if future results align with expectations.
Explore the SWS fair ratio for PACS Group
Result: Price-to-Earnings of 23x (OVERVALUED)
However, slowing one-year returns and overvaluation compared to peers could expose PACS Group to downside risk if growth stalls or if market sentiment shifts.
Find out about the key risks to this PACS Group narrative.
Another View: What Does the SWS DCF Model Tell Us?
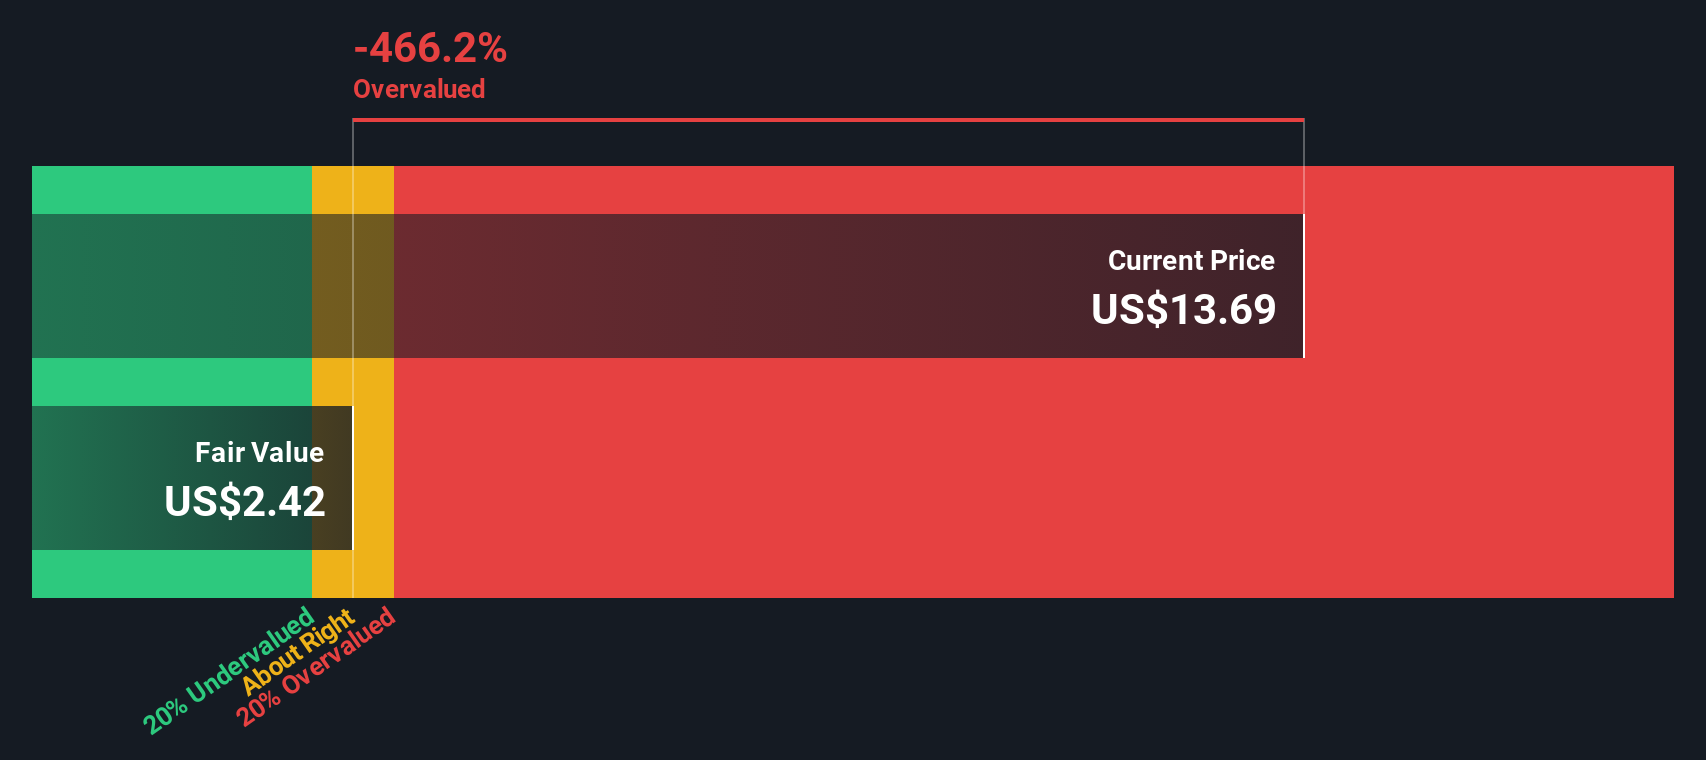
Taking a different approach, the SWS DCF model estimates PACS Group’s fair value at $2.42, which is much lower than its current price of $13.69. This suggests the stock is significantly overvalued from a discounted cash flow perspective. Does this sharp disconnect highlight a cautionary risk for investors, or is the market seeing something the numbers miss?
Look into how the SWS DCF model arrives at its fair value.
Simply Wall St performs a discounted cash flow (DCF) on every stock in the world every day (check out PACS Group for example). We show the entire calculation in full. You can track the result in your watchlist or portfolio and be alerted when this changes, or use our stock screener to discover undervalued stocks based on their cash flows. If you save a screener we even alert you when new companies match - so you never miss a potential opportunity.
Build Your Own PACS Group Narrative
If you want to dig deeper or draw your own conclusions, take a few minutes to explore the numbers and build your own narrative. Do it your way.
A great starting point for your PACS Group research is our analysis highlighting 3 key rewards and 4 important warning signs that could impact your investment decision.
Looking for More Smart Investment Ideas?
There’s a world of opportunity beyond PACS Group. Don’t let your next potential winner slip away. Use these tailored tools to uncover promising stocks most investors overlook.
- Multiply your passive income by tapping into steady yield and financial strength with these 19 dividend stocks with yields > 3%.
- Expand your portfolio into disruptive technology by targeting breakthrough companies driving artificial intelligence innovation through these 24 AI penny stocks.
- Catch value mispricings before the crowd moves in by searching for tomorrow’s growth leaders among these 895 undervalued stocks based on cash flows.
This article by Simply Wall St is general in nature. We provide commentary based on historical data and analyst forecasts only using an unbiased methodology and our articles are not intended to be financial advice. It does not constitute a recommendation to buy or sell any stock, and does not take account of your objectives, or your financial situation. We aim to bring you long-term focused analysis driven by fundamental data. Note that our analysis may not factor in the latest price-sensitive company announcements or qualitative material. Simply Wall St has no position in any stocks mentioned.
New: Manage All Your Stock Portfolios in One Place
We've created the ultimate portfolio companion for stock investors, and it's free.
• Connect an unlimited number of Portfolios and see your total in one currency
• Be alerted to new Warning Signs or Risks via email or mobile
• Track the Fair Value of your stocks
Have feedback on this article? Concerned about the content? Get in touch with us directly. Alternatively, email editorial-team@simplywallst.com
About NYSE:PACS
PACS Group
Through its subsidiaries, operates skilled nursing facilities and assisted living facilities in the United States.
Reasonable growth potential with slight risk.
Similar Companies
Market Insights

Advertisement
Community Narratives
The Next Phase of Energy Storage: How NeoVolta Is Tackling America’s Power Crunch
Fair Value US$7.50|35.1% undervalued
MA
Community Contributor
Why EnSilica is Worth Possibly 13x its Current Price
Fair Value UK£5.00|89.8% undervalued
DO
Community Contributor
M&A Activity, Industry Diversification & A Defense Contract Monopoly Will Push BWXT For Healthy Long-Term Growth
Fair Value US$220.00|15.2% undervalued
CL
Community Contributor
A case for Cassiar Gold Corp (TSXV: GLDC) to reach CAD$8-10 before 2030 (X30-37)
Fair Value CA$10.00|96.0% undervalued
AG
Community Contributor