Advertisement
- United States
- /
- Healthcare Services
- /
- NYSE:CI
How Does Cigna Stack Up After Its 8.5% Weekly Surge in 2025?

Simply Wall St
Reviewed by Bailey Pemberton
Thinking about what to do with your Cigna Group shares? You are definitely not alone. After a stretch of ups and downs, the stock has turned heads with an 8.5% jump over the past week, with a year-to-date climb of 13.3%. Of course, that is after a challenging 1-year drop of 6.9% which had plenty of investors second-guessing their positions. It is no secret that Cigna tends to spark strong opinions, whether due to shifts in healthcare policy or broader market optimism about managed care companies. The last five years underscore this resilience, with the stock gaining more than 90% despite recent volatility.
Right now, Cigna has become a real conversation starter, especially since its value score sits at an impressive 5 out of 6. That means, according to our checklist of valuation methods, Cigna is undervalued in almost every major category we look at. There has been a noticeable shift in risk sentiment, with some investors increasingly attracted by the company’s solid fundamentals and long-term track record. As we break down how Cigna stacks up across different traditional valuation checks, keep in mind there is an even more insightful way to look at its true value. We will get to that by the end of this article.
Approach 1: Cigna Group Discounted Cash Flow (DCF) Analysis
The Discounted Cash Flow (DCF) model estimates a company’s intrinsic value by projecting its future cash flows and then discounting those amounts back to today’s value. This method is widely used because it focuses on the fundamental ability of a business to generate cash for shareholders over time.
For Cigna Group, the most recent twelve months of Free Cash Flow (FCF) stand at $3.6 Billion. Analyst forecasts see this figure growing each year, with FCF projected to reach $12.8 Billion by the end of 2029. While analysts directly provide estimates for the next five years, further cash flow projections out to 2035 are logically extrapolated and show a continued upward trajectory.
Based on this model's full calculations, Cigna's fair value is estimated at $1,162.59 per share. This implies that the stock is trading at a significant 73.2% discount to its intrinsic value, indicating it is deeply undervalued according to the DCF analysis.
Result: UNDERVALUED
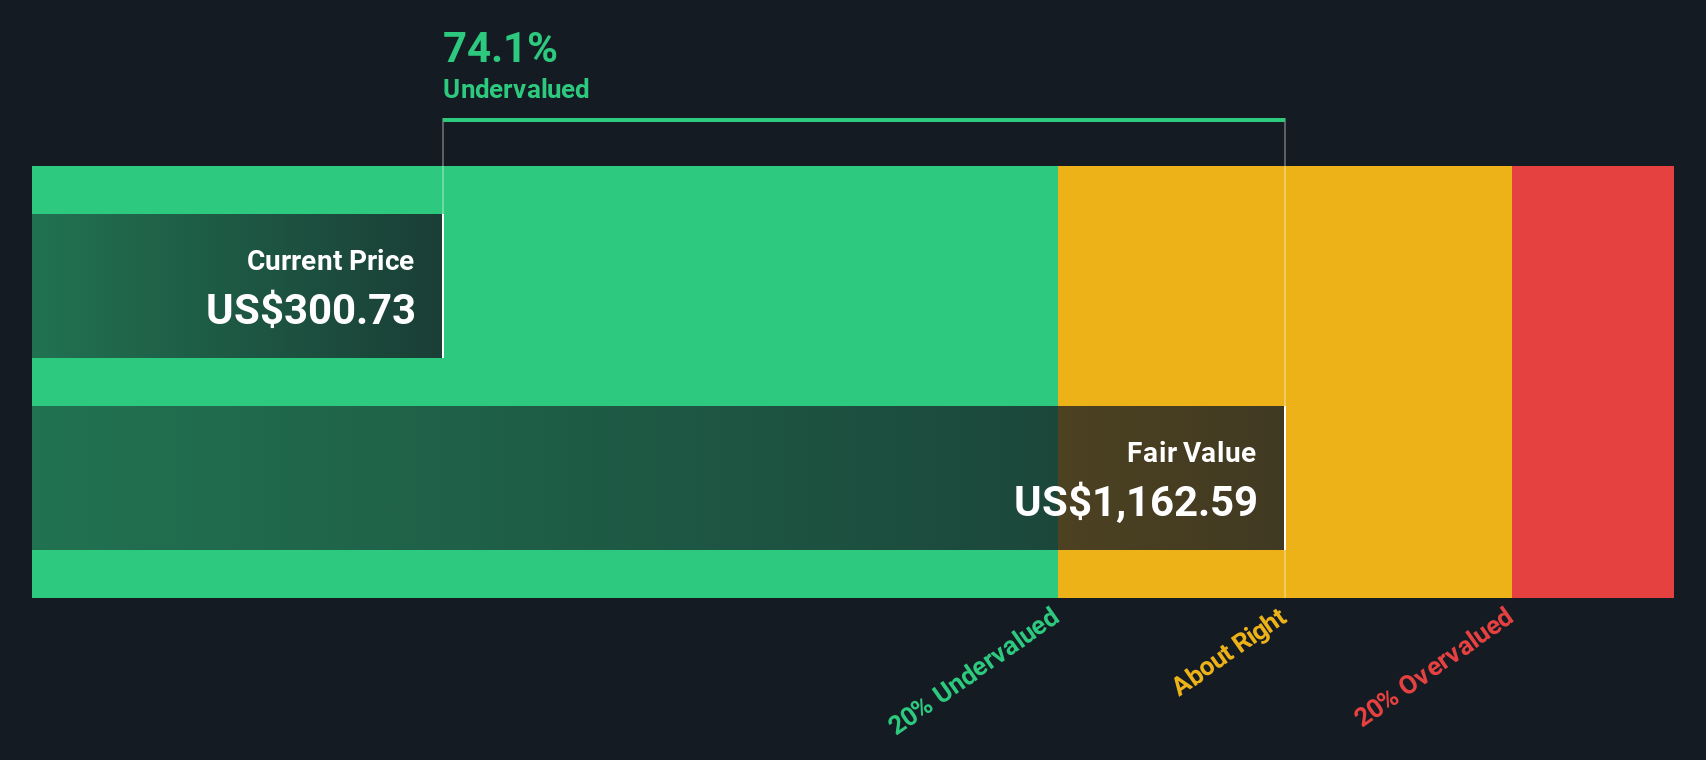
Our Discounted Cash Flow (DCF) analysis suggests Cigna Group is undervalued by 73.2%. Track this in your watchlist or portfolio, or discover more undervalued stocks.
Approach 2: Cigna Group Price vs Earnings
The Price-to-Earnings (PE) ratio is a tried-and-true valuation tool for profitable companies like Cigna Group. It connects a company’s share price to its earnings, giving investors a straightforward way to see how a stock is valued relative to its profit generation. For established and consistently profitable businesses, the PE ratio is widely used because it reflects what the market is willing to pay for current and future earnings power.
Growth expectations and risk are critical to interpreting what a “normal” or “fair” PE ratio should be. Rapidly growing companies or those seen as having lower risk typically trade at higher PE ratios. In contrast, slower growers or riskier firms sit at lower multiples. That means looking at Cigna’s PE ratio in context is essential when considering its true value.
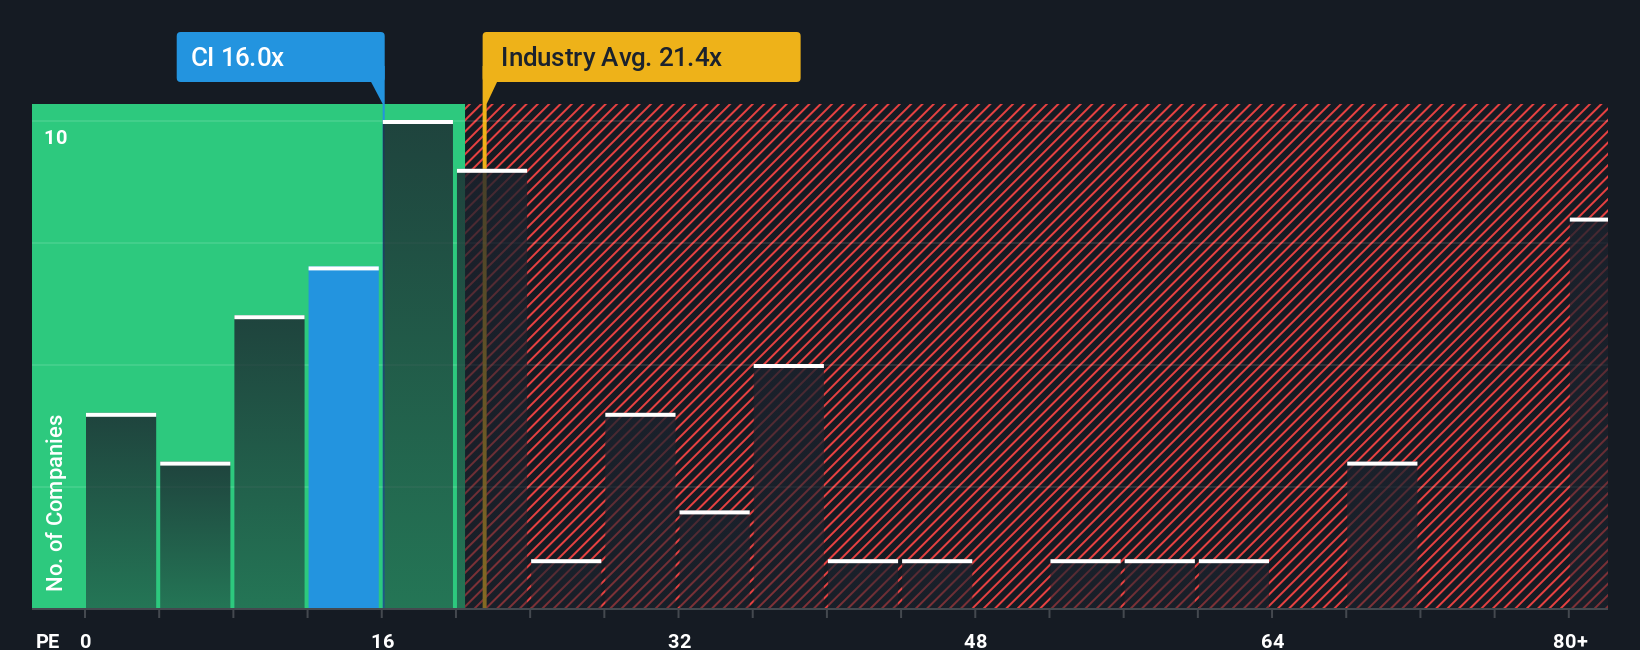
Cigna Group currently trades on a PE ratio of 16.5x, which is lower than both its peer average of 21.1x and the broader healthcare industry average of 21.4x. On the surface, this suggests the stock is undervalued compared to similar companies. However, to get a fuller picture, Simply Wall St’s proprietary Fair Ratio goes a step further. This metric estimates what the PE multiple should be, considering not just Cigna’s growth outlook, but also its profit margins, risk profile, size, and where it sits within the healthcare sector.
The Fair Ratio for Cigna comes in at 30.3x, which is substantially above the current PE of 16.5x. Because the Fair Ratio adjusts for growth, profitability, and risks unique to Cigna, it provides a more tailored, realistic indication of relative value than simply comparing industry or peer averages. This significant difference to its Fair Ratio reinforces the view that Cigna is attractively valued on earnings right now.
Result: UNDERVALUED
PE ratios tell one story, but what if the real opportunity lies elsewhere? Discover companies where insiders are betting big on explosive growth.
Upgrade Your Decision Making: Choose your Cigna Group Narrative
Earlier we mentioned that there is an even better way to understand valuation, so let us introduce you to Narratives. A Narrative is simply your own investor “story”—a way to describe what you believe about a company’s future and connect that belief directly to financial forecasts like future revenues, margins, and, ultimately, a fair value for the stock.
Instead of just focusing on numbers, Narratives allow you to pull together your perspective on where Cigna Group is headed, then see how that translates into a share price you feel confident in. On Simply Wall St’s Community page, millions of investors use Narratives as an easy, accessible tool to set assumptions, generate dynamic fair values, and compare those directly to the current price to help decide if it is time to buy, sell, or hold.
Narratives automatically update as new news or earnings information comes in, keeping your outlook current and reflective of market events. For Cigna, this means you might see one investor forecast a bright future with a share price target over $428, while another, more cautious perspective values it closer to $300, all based on their own stories about revenue growth, risks, and margins.
Do you think there's more to the story for Cigna Group? Create your own Narrative to let the Community know!

This article by Simply Wall St is general in nature. We provide commentary based on historical data and analyst forecasts only using an unbiased methodology and our articles are not intended to be financial advice. It does not constitute a recommendation to buy or sell any stock, and does not take account of your objectives, or your financial situation. We aim to bring you long-term focused analysis driven by fundamental data. Note that our analysis may not factor in the latest price-sensitive company announcements or qualitative material. Simply Wall St has no position in any stocks mentioned.
New: AI Stock Screener & Alerts
Our new AI Stock Screener scans the market every day to uncover opportunities.
• Dividend Powerhouses (3%+ Yield)
• Undervalued Small Caps with Insider Buying
• High growth Tech and AI Companies
Or build your own from over 50 metrics.
Have feedback on this article? Concerned about the content? Get in touch with us directly. Alternatively, email editorial-team@simplywallst.com
About NYSE:CI
Cigna Group
Provides insurance and related products and services in the United States.
Undervalued established dividend payer.
Similar Companies
Market Insights

Advertisement
Community Narratives
The Next Phase of Energy Storage: How NeoVolta Is Tackling America’s Power Crunch
Fair Value US$7.50|35.1% undervalued
MA
Community Contributor
Why EnSilica is Worth Possibly 13x its Current Price
Fair Value UK£5.00|89.8% undervalued
DO
Community Contributor
M&A Activity, Industry Diversification & A Defense Contract Monopoly Will Push BWXT For Healthy Long-Term Growth
Fair Value US$220.00|15.2% undervalued
CL
Community Contributor
A case for Cassiar Gold Corp (TSXV: GLDC) to reach CAD$8-10 before 2030 (X30-37)
Fair Value CA$10.00|96.0% undervalued
AG
Community Contributor