- United States
- /
- Healthcare Services
- /
- NYSE:CAH
Is Cardinal Health, Inc. (NYSE:CAH) Trading At A 50% Discount?


Key Insights
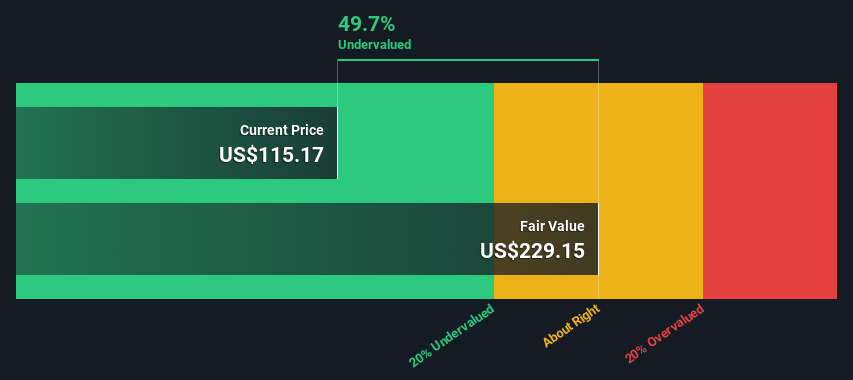
- The projected fair value for Cardinal Health is US$229 based on 2 Stage Free Cash Flow to Equity
- Cardinal Health's US$115 share price signals that it might be 50% undervalued
- Our fair value estimate is 102% higher than Cardinal Health's analyst price target of US$113
Today we will run through one way of estimating the intrinsic value of Cardinal Health, Inc. (NYSE:CAH) by taking the expected future cash flows and discounting them to today's value. Our analysis will employ the Discounted Cash Flow (DCF) model. Believe it or not, it's not too difficult to follow, as you'll see from our example!
We generally believe that a company's value is the present value of all of the cash it will generate in the future. However, a DCF is just one valuation metric among many, and it is not without flaws. For those who are keen learners of equity analysis, the Simply Wall St analysis model here may be something of interest to you.
Check out our latest analysis for Cardinal Health
Step By Step Through The Calculation
We are going to use a two-stage DCF model, which, as the name states, takes into account two stages of growth. The first stage is generally a higher growth period which levels off heading towards the terminal value, captured in the second 'steady growth' period. To begin with, we have to get estimates of the next ten years of cash flows. Where possible we use analyst estimates, but when these aren't available we extrapolate the previous free cash flow (FCF) from the last estimate or reported value. We assume companies with shrinking free cash flow will slow their rate of shrinkage, and that companies with growing free cash flow will see their growth rate slow, over this period. We do this to reflect that growth tends to slow more in the early years than it does in later years.
A DCF is all about the idea that a dollar in the future is less valuable than a dollar today, and so the sum of these future cash flows is then discounted to today's value:
10-year free cash flow (FCF) forecast
| 2024 | 2025 | 2026 | 2027 | 2028 | 2029 | 2030 | 2031 | 2032 | 2033 | |
| Levered FCF ($, Millions) | US$2.13b | US$2.01b | US$2.16b | US$1.83b | US$2.27b | US$2.32b | US$2.37b | US$2.42b | US$2.47b | US$2.53b |
| Growth Rate Estimate Source | Analyst x7 | Analyst x8 | Analyst x5 | Analyst x2 | Analyst x2 | Est @ 2.14% | Est @ 2.19% | Est @ 2.22% | Est @ 2.24% | Est @ 2.25% |
| Present Value ($, Millions) Discounted @ 6.0% | US$2.0k | US$1.8k | US$1.8k | US$1.5k | US$1.7k | US$1.6k | US$1.6k | US$1.5k | US$1.5k | US$1.4k |
("Est" = FCF growth rate estimated by Simply Wall St)
Present Value of 10-year Cash Flow (PVCF) = US$16b
After calculating the present value of future cash flows in the initial 10-year period, we need to calculate the Terminal Value, which accounts for all future cash flows beyond the first stage. The Gordon Growth formula is used to calculate Terminal Value at a future annual growth rate equal to the 5-year average of the 10-year government bond yield of 2.3%. We discount the terminal cash flows to today's value at a cost of equity of 6.0%.
Terminal Value (TV)= FCF2033 × (1 + g) ÷ (r – g) = US$2.5b× (1 + 2.3%) ÷ (6.0%– 2.3%) = US$70b
Present Value of Terminal Value (PVTV)= TV / (1 + r)10= US$70b÷ ( 1 + 6.0%)10= US$39b
The total value, or equity value, is then the sum of the present value of the future cash flows, which in this case is US$56b. To get the intrinsic value per share, we divide this by the total number of shares outstanding. Relative to the current share price of US$115, the company appears quite good value at a 50% discount to where the stock price trades currently. Valuations are imprecise instruments though, rather like a telescope - move a few degrees and end up in a different galaxy. Do keep this in mind.
Important Assumptions
Now the most important inputs to a discounted cash flow are the discount rate, and of course, the actual cash flows. Part of investing is coming up with your own evaluation of a company's future performance, so try the calculation yourself and check your own assumptions. The DCF also does not consider the possible cyclicality of an industry, or a company's future capital requirements, so it does not give a full picture of a company's potential performance. Given that we are looking at Cardinal Health as potential shareholders, the cost of equity is used as the discount rate, rather than the cost of capital (or weighted average cost of capital, WACC) which accounts for debt. In this calculation we've used 6.0%, which is based on a levered beta of 0.800. Beta is a measure of a stock's volatility, compared to the market as a whole. We get our beta from the industry average beta of globally comparable companies, with an imposed limit between 0.8 and 2.0, which is a reasonable range for a stable business.
SWOT Analysis for Cardinal Health
- Debt is well covered by earnings and cashflows.
- Dividends are covered by earnings and cash flows.
- Dividend is low compared to the top 25% of dividend payers in the Healthcare market.
- Annual earnings are forecast to grow faster than the American market.
- Trading below our estimate of fair value by more than 20%.
- Total liabilities exceed total assets, which raises the risk of financial distress.
- Annual revenue is forecast to grow slower than the American market.
Looking Ahead:
Although the valuation of a company is important, it ideally won't be the sole piece of analysis you scrutinize for a company. The DCF model is not a perfect stock valuation tool. Instead the best use for a DCF model is to test certain assumptions and theories to see if they would lead to the company being undervalued or overvalued. If a company grows at a different rate, or if its cost of equity or risk free rate changes sharply, the output can look very different. Can we work out why the company is trading at a discount to intrinsic value? For Cardinal Health, we've compiled three fundamental factors you should look at:
- Risks: For example, we've discovered 3 warning signs for Cardinal Health that you should be aware of before investing here.
- Future Earnings: How does CAH's growth rate compare to its peers and the wider market? Dig deeper into the analyst consensus number for the upcoming years by interacting with our free analyst growth expectation chart.
- Other High Quality Alternatives: Do you like a good all-rounder? Explore our interactive list of high quality stocks to get an idea of what else is out there you may be missing!
PS. The Simply Wall St app conducts a discounted cash flow valuation for every stock on the NYSE every day. If you want to find the calculation for other stocks just search here.
New: AI Stock Screener & Alerts
Our new AI Stock Screener scans the market every day to uncover opportunities.
• Dividend Powerhouses (3%+ Yield)
• Undervalued Small Caps with Insider Buying
• High growth Tech and AI Companies
Or build your own from over 50 metrics.
Have feedback on this article? Concerned about the content? Get in touch with us directly. Alternatively, email editorial-team (at) simplywallst.com.
This article by Simply Wall St is general in nature. We provide commentary based on historical data and analyst forecasts only using an unbiased methodology and our articles are not intended to be financial advice. It does not constitute a recommendation to buy or sell any stock, and does not take account of your objectives, or your financial situation. We aim to bring you long-term focused analysis driven by fundamental data. Note that our analysis may not factor in the latest price-sensitive company announcements or qualitative material. Simply Wall St has no position in any stocks mentioned.
About NYSE:CAH
Cardinal Health
Operates as a healthcare services and products company in the United States, Canada, Europe, Asia, and internationally.
Undervalued with solid track record and pays a dividend.

