

Key Insights
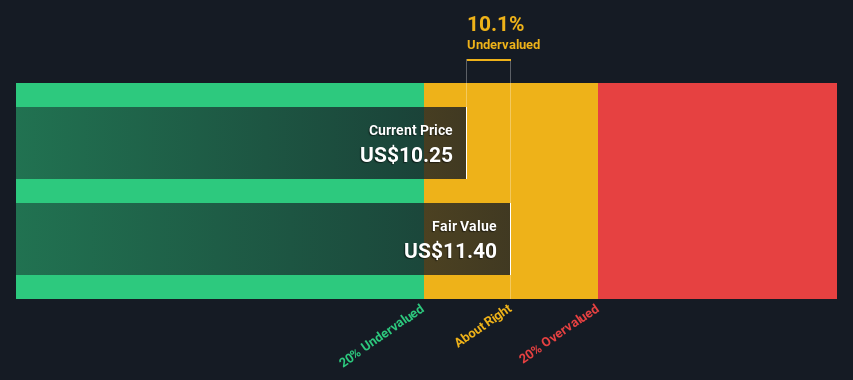
- Using the 2 Stage Free Cash Flow to Equity, Agiliti fair value estimate is US$11.40
- Agiliti's US$10.25 share price indicates it is trading at similar levels as its fair value estimate
- Analyst price target for AGTI is US$17.00, which is 49% above our fair value estimate
Does the August share price for Agiliti, Inc. (NYSE:AGTI) reflect what it's really worth? Today, we will estimate the stock's intrinsic value by taking the expected future cash flows and discounting them to their present value. We will take advantage of the Discounted Cash Flow (DCF) model for this purpose. Don't get put off by the jargon, the math behind it is actually quite straightforward.
Companies can be valued in a lot of ways, so we would point out that a DCF is not perfect for every situation. Anyone interested in learning a bit more about intrinsic value should have a read of the Simply Wall St analysis model.
Check out our latest analysis for Agiliti
Crunching The Numbers
We use what is known as a 2-stage model, which simply means we have two different periods of growth rates for the company's cash flows. Generally the first stage is higher growth, and the second stage is a lower growth phase. To begin with, we have to get estimates of the next ten years of cash flows. Seeing as no analyst estimates of free cash flow are available to us, we have extrapolate the previous free cash flow (FCF) from the company's last reported value. We assume companies with shrinking free cash flow will slow their rate of shrinkage, and that companies with growing free cash flow will see their growth rate slow, over this period. We do this to reflect that growth tends to slow more in the early years than it does in later years.
Generally we assume that a dollar today is more valuable than a dollar in the future, and so the sum of these future cash flows is then discounted to today's value:
10-year free cash flow (FCF) estimate
| 2024 | 2025 | 2026 | 2027 | 2028 | 2029 | 2030 | 2031 | 2032 | 2033 | |
| Levered FCF ($, Millions) | US$92.0m | US$88.6m | US$86.9m | US$86.3m | US$86.5m | US$87.1m | US$88.1m | US$89.4m | US$90.9m | US$92.6m |
| Growth Rate Estimate Source | Est @ -6.15% | Est @ -3.66% | Est @ -1.92% | Est @ -0.70% | Est @ 0.16% | Est @ 0.76% | Est @ 1.17% | Est @ 1.47% | Est @ 1.67% | Est @ 1.82% |
| Present Value ($, Millions) Discounted @ 7.2% | US$85.8 | US$77.1 | US$70.5 | US$65.3 | US$61.0 | US$57.3 | US$54.0 | US$51.1 | US$48.5 | US$46.0 |
("Est" = FCF growth rate estimated by Simply Wall St)
Present Value of 10-year Cash Flow (PVCF) = US$617m
After calculating the present value of future cash flows in the initial 10-year period, we need to calculate the Terminal Value, which accounts for all future cash flows beyond the first stage. The Gordon Growth formula is used to calculate Terminal Value at a future annual growth rate equal to the 5-year average of the 10-year government bond yield of 2.2%. We discount the terminal cash flows to today's value at a cost of equity of 7.2%.
Terminal Value (TV)= FCF2033 × (1 + g) ÷ (r – g) = US$93m× (1 + 2.2%) ÷ (7.2%– 2.2%) = US$1.9b
Present Value of Terminal Value (PVTV)= TV / (1 + r)10= US$1.9b÷ ( 1 + 7.2%)10= US$923m
The total value is the sum of cash flows for the next ten years plus the discounted terminal value, which results in the Total Equity Value, which in this case is US$1.5b. To get the intrinsic value per share, we divide this by the total number of shares outstanding. Compared to the current share price of US$10.3, the company appears about fair value at a 10% discount to where the stock price trades currently. The assumptions in any calculation have a big impact on the valuation, so it is better to view this as a rough estimate, not precise down to the last cent.
Important Assumptions
The calculation above is very dependent on two assumptions. The first is the discount rate and the other is the cash flows. If you don't agree with these result, have a go at the calculation yourself and play with the assumptions. The DCF also does not consider the possible cyclicality of an industry, or a company's future capital requirements, so it does not give a full picture of a company's potential performance. Given that we are looking at Agiliti as potential shareholders, the cost of equity is used as the discount rate, rather than the cost of capital (or weighted average cost of capital, WACC) which accounts for debt. In this calculation we've used 7.2%, which is based on a levered beta of 1.018. Beta is a measure of a stock's volatility, compared to the market as a whole. We get our beta from the industry average beta of globally comparable companies, with an imposed limit between 0.8 and 2.0, which is a reasonable range for a stable business.
SWOT Analysis for Agiliti
- No major strengths identified for AGTI.
- Earnings declined over the past year.
- Interest payments on debt are not well covered.
- Annual earnings are forecast to grow faster than the American market.
- Current share price is below our estimate of fair value.
- Debt is not well covered by operating cash flow.
- Annual revenue is forecast to grow slower than the American market.
Moving On:
Whilst important, the DCF calculation ideally won't be the sole piece of analysis you scrutinize for a company. DCF models are not the be-all and end-all of investment valuation. Preferably you'd apply different cases and assumptions and see how they would impact the company's valuation. If a company grows at a different rate, or if its cost of equity or risk free rate changes sharply, the output can look very different. For Agiliti, there are three further elements you should further research:
- Risks: Every company has them, and we've spotted 5 warning signs for Agiliti (of which 1 makes us a bit uncomfortable!) you should know about.
- Future Earnings: How does AGTI's growth rate compare to its peers and the wider market? Dig deeper into the analyst consensus number for the upcoming years by interacting with our free analyst growth expectation chart.
- Other High Quality Alternatives: Do you like a good all-rounder? Explore our interactive list of high quality stocks to get an idea of what else is out there you may be missing!
PS. The Simply Wall St app conducts a discounted cash flow valuation for every stock on the NYSE every day. If you want to find the calculation for other stocks just search here.
New: Manage All Your Stock Portfolios in One Place
We've created the ultimate portfolio companion for stock investors, and it's free.
• Connect an unlimited number of Portfolios and see your total in one currency
• Be alerted to new Warning Signs or Risks via email or mobile
• Track the Fair Value of your stocks
Have feedback on this article? Concerned about the content? Get in touch with us directly. Alternatively, email editorial-team (at) simplywallst.com.
This article by Simply Wall St is general in nature. We provide commentary based on historical data and analyst forecasts only using an unbiased methodology and our articles are not intended to be financial advice. It does not constitute a recommendation to buy or sell any stock, and does not take account of your objectives, or your financial situation. We aim to bring you long-term focused analysis driven by fundamental data. Note that our analysis may not factor in the latest price-sensitive company announcements or qualitative material. Simply Wall St has no position in any stocks mentioned.
About NYSE:AGTI
Agiliti
Agiliti, Inc., together with its subsidiaries, provides healthcare technology management and service solutions to the healthcare industry in the United States.
Good value with adequate balance sheet.
Market Insights

Community Narratives


