

Key Insights
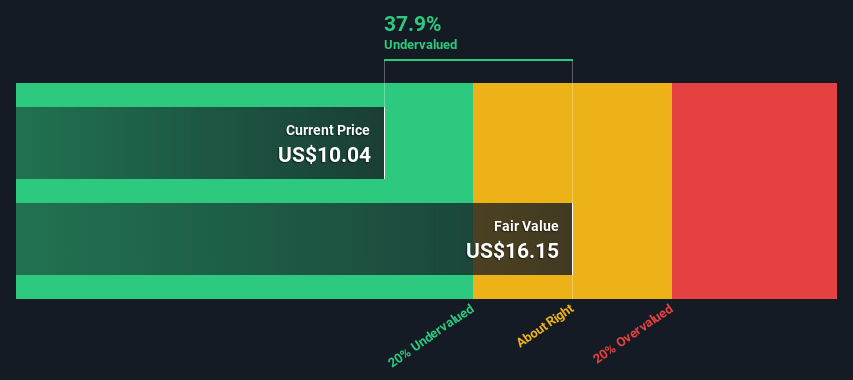
- The projected fair value for TruBridge is US$16.15 based on 2 Stage Free Cash Flow to Equity
- Current share price of US$10.04 suggests TruBridge is potentially 38% undervalued
- The US$13.80 analyst price target for TBRG is 15% less than our estimate of fair value
Does the May share price for TruBridge, Inc. (NASDAQ:TBRG) reflect what it's really worth? Today, we will estimate the stock's intrinsic value by projecting its future cash flows and then discounting them to today's value. We will take advantage of the Discounted Cash Flow (DCF) model for this purpose. Don't get put off by the jargon, the math behind it is actually quite straightforward.
We would caution that there are many ways of valuing a company and, like the DCF, each technique has advantages and disadvantages in certain scenarios. For those who are keen learners of equity analysis, the Simply Wall St analysis model here may be something of interest to you.
See our latest analysis for TruBridge
The Model
We're using the 2-stage growth model, which simply means we take in account two stages of company's growth. In the initial period the company may have a higher growth rate and the second stage is usually assumed to have a stable growth rate. In the first stage we need to estimate the cash flows to the business over the next ten years. Where possible we use analyst estimates, but when these aren't available we extrapolate the previous free cash flow (FCF) from the last estimate or reported value. We assume companies with shrinking free cash flow will slow their rate of shrinkage, and that companies with growing free cash flow will see their growth rate slow, over this period. We do this to reflect that growth tends to slow more in the early years than it does in later years.
Generally we assume that a dollar today is more valuable than a dollar in the future, so we need to discount the sum of these future cash flows to arrive at a present value estimate:
10-year free cash flow (FCF) forecast
| 2024 | 2025 | 2026 | 2027 | 2028 | 2029 | 2030 | 2031 | 2032 | 2033 | |
| Levered FCF ($, Millions) | US$5.28m | US$11.9m | US$14.2m | US$16.2m | US$17.9m | US$19.4m | US$20.6m | US$21.7m | US$22.7m | US$23.5m |
| Growth Rate Estimate Source | Analyst x1 | Analyst x1 | Est @ 19.25% | Est @ 14.19% | Est @ 10.64% | Est @ 8.17% | Est @ 6.43% | Est @ 5.21% | Est @ 4.36% | Est @ 3.77% |
| Present Value ($, Millions) Discounted @ 9.6% | US$4.8 | US$9.9 | US$10.8 | US$11.2 | US$11.3 | US$11.2 | US$10.8 | US$10.4 | US$9.9 | US$9.4 |
("Est" = FCF growth rate estimated by Simply Wall St)
Present Value of 10-year Cash Flow (PVCF) = US$100m
The second stage is also known as Terminal Value, this is the business's cash flow after the first stage. The Gordon Growth formula is used to calculate Terminal Value at a future annual growth rate equal to the 5-year average of the 10-year government bond yield of 2.4%. We discount the terminal cash flows to today's value at a cost of equity of 9.6%.
Terminal Value (TV)= FCF2033 × (1 + g) ÷ (r – g) = US$24m× (1 + 2.4%) ÷ (9.6%– 2.4%) = US$332m
Present Value of Terminal Value (PVTV)= TV / (1 + r)10= US$332m÷ ( 1 + 9.6%)10= US$132m
The total value, or equity value, is then the sum of the present value of the future cash flows, which in this case is US$232m. The last step is to then divide the equity value by the number of shares outstanding. Relative to the current share price of US$10.0, the company appears quite good value at a 38% discount to where the stock price trades currently. Remember though, that this is just an approximate valuation, and like any complex formula - garbage in, garbage out.
The Assumptions
Now the most important inputs to a discounted cash flow are the discount rate, and of course, the actual cash flows. Part of investing is coming up with your own evaluation of a company's future performance, so try the calculation yourself and check your own assumptions. The DCF also does not consider the possible cyclicality of an industry, or a company's future capital requirements, so it does not give a full picture of a company's potential performance. Given that we are looking at TruBridge as potential shareholders, the cost of equity is used as the discount rate, rather than the cost of capital (or weighted average cost of capital, WACC) which accounts for debt. In this calculation we've used 9.6%, which is based on a levered beta of 1.577. Beta is a measure of a stock's volatility, compared to the market as a whole. We get our beta from the industry average beta of globally comparable companies, with an imposed limit between 0.8 and 2.0, which is a reasonable range for a stable business.
SWOT Analysis for TruBridge
- Debt is well covered by earnings.
- No major weaknesses identified for TBRG.
- Forecast to reduce losses next year.
- Has sufficient cash runway for more than 3 years based on current free cash flows.
- Good value based on P/S ratio and estimated fair value.
- Significant insider buying over the past 3 months.
- Debt is not well covered by operating cash flow.
- Not expected to become profitable over the next 3 years.
Moving On:
Although the valuation of a company is important, it is only one of many factors that you need to assess for a company. DCF models are not the be-all and end-all of investment valuation. Instead the best use for a DCF model is to test certain assumptions and theories to see if they would lead to the company being undervalued or overvalued. If a company grows at a different rate, or if its cost of equity or risk free rate changes sharply, the output can look very different. Why is the intrinsic value higher than the current share price? For TruBridge, there are three important items you should further research:
- Risks: Every company has them, and we've spotted 1 warning sign for TruBridge you should know about.
- Future Earnings: How does TBRG's growth rate compare to its peers and the wider market? Dig deeper into the analyst consensus number for the upcoming years by interacting with our free analyst growth expectation chart.
- Other Solid Businesses: Low debt, high returns on equity and good past performance are fundamental to a strong business. Why not explore our interactive list of stocks with solid business fundamentals to see if there are other companies you may not have considered!
PS. The Simply Wall St app conducts a discounted cash flow valuation for every stock on the NASDAQGS every day. If you want to find the calculation for other stocks just search here.
Valuation is complex, but we're here to simplify it.
Discover if TruBridge might be undervalued or overvalued with our detailed analysis, featuring fair value estimates, potential risks, dividends, insider trades, and its financial condition.
Access Free AnalysisHave feedback on this article? Concerned about the content? Get in touch with us directly. Alternatively, email editorial-team (at) simplywallst.com.
This article by Simply Wall St is general in nature. We provide commentary based on historical data and analyst forecasts only using an unbiased methodology and our articles are not intended to be financial advice. It does not constitute a recommendation to buy or sell any stock, and does not take account of your objectives, or your financial situation. We aim to bring you long-term focused analysis driven by fundamental data. Note that our analysis may not factor in the latest price-sensitive company announcements or qualitative material. Simply Wall St has no position in any stocks mentioned.
About NasdaqGS:TBRG
TruBridge
Provides healthcare solutions and services for community hospitals, clinics, and other healthcare systems in the United States and internationally.
Fair value with moderate growth potential.
Similar Companies
Market Insights

Community Narratives
