- United States
- /
- Consumer Durables
- /
- NasdaqGM:STRR
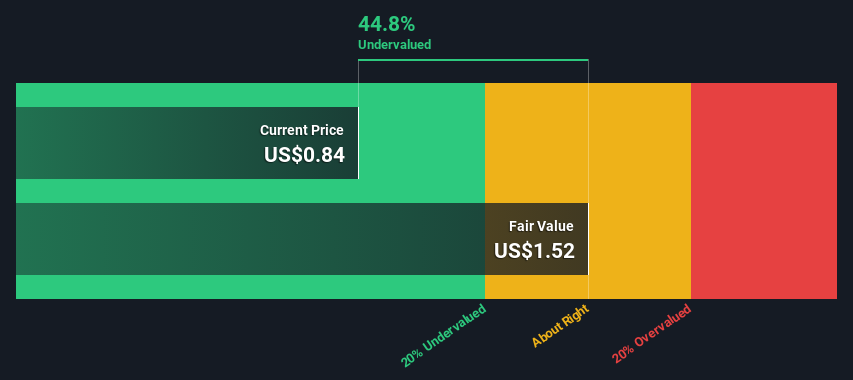
Star Equity Holdings, Inc. (NASDAQ:STRR) Shares Could Be 45% Below Their Intrinsic Value Estimate


Key Insights
- The projected fair value for Star Equity Holdings is US$1.52 based on 2 Stage Free Cash Flow to Equity
- Current share price of US$0.84 suggests Star Equity Holdings is potentially 45% undervalued
- Star Equity Holdings' peers are currently trading at a premium of 164% on average
Today we'll do a simple run through of a valuation method used to estimate the attractiveness of Star Equity Holdings, Inc. (NASDAQ:STRR) as an investment opportunity by estimating the company's future cash flows and discounting them to their present value. Our analysis will employ the Discounted Cash Flow (DCF) model. It may sound complicated, but actually it is quite simple!
We generally believe that a company's value is the present value of all of the cash it will generate in the future. However, a DCF is just one valuation metric among many, and it is not without flaws. If you want to learn more about discounted cash flow, the rationale behind this calculation can be read in detail in the Simply Wall St analysis model.
View our latest analysis for Star Equity Holdings
The Model
We are going to use a two-stage DCF model, which, as the name states, takes into account two stages of growth. The first stage is generally a higher growth period which levels off heading towards the terminal value, captured in the second 'steady growth' period. To begin with, we have to get estimates of the next ten years of cash flows. Where possible we use analyst estimates, but when these aren't available we extrapolate the previous free cash flow (FCF) from the last estimate or reported value. We assume companies with shrinking free cash flow will slow their rate of shrinkage, and that companies with growing free cash flow will see their growth rate slow, over this period. We do this to reflect that growth tends to slow more in the early years than it does in later years.
Generally we assume that a dollar today is more valuable than a dollar in the future, and so the sum of these future cash flows is then discounted to today's value:
10-year free cash flow (FCF) estimate
| 2024 | 2025 | 2026 | 2027 | 2028 | 2029 | 2030 | 2031 | 2032 | 2033 | |
| Levered FCF ($, Millions) | US$1.00m | US$1.00m | US$1.01m | US$1.02m | US$1.03m | US$1.05m | US$1.07m | US$1.09m | US$1.11m | US$1.13m |
| Growth Rate Estimate Source | Analyst x1 | Est @ 0.04% | Est @ 0.67% | Est @ 1.12% | Est @ 1.43% | Est @ 1.64% | Est @ 1.80% | Est @ 1.90% | Est @ 1.98% | Est @ 2.03% |
| Present Value ($, Millions) Discounted @ 6.2% | US$0.9 | US$0.9 | US$0.8 | US$0.8 | US$0.8 | US$0.7 | US$0.7 | US$0.7 | US$0.6 | US$0.6 |
("Est" = FCF growth rate estimated by Simply Wall St)
Present Value of 10-year Cash Flow (PVCF) = US$7.6m
We now need to calculate the Terminal Value, which accounts for all the future cash flows after this ten year period. The Gordon Growth formula is used to calculate Terminal Value at a future annual growth rate equal to the 5-year average of the 10-year government bond yield of 2.2%. We discount the terminal cash flows to today's value at a cost of equity of 6.2%.
Terminal Value (TV)= FCF2033 × (1 + g) ÷ (r – g) = US$1.1m× (1 + 2.2%) ÷ (6.2%– 2.2%) = US$29m
Present Value of Terminal Value (PVTV)= TV / (1 + r)10= US$29m÷ ( 1 + 6.2%)10= US$16m
The total value, or equity value, is then the sum of the present value of the future cash flows, which in this case is US$24m. In the final step we divide the equity value by the number of shares outstanding. Compared to the current share price of US$0.8, the company appears quite undervalued at a 45% discount to where the stock price trades currently. The assumptions in any calculation have a big impact on the valuation, so it is better to view this as a rough estimate, not precise down to the last cent.
The Assumptions
We would point out that the most important inputs to a discounted cash flow are the discount rate and of course the actual cash flows. If you don't agree with these result, have a go at the calculation yourself and play with the assumptions. The DCF also does not consider the possible cyclicality of an industry, or a company's future capital requirements, so it does not give a full picture of a company's potential performance. Given that we are looking at Star Equity Holdings as potential shareholders, the cost of equity is used as the discount rate, rather than the cost of capital (or weighted average cost of capital, WACC) which accounts for debt. In this calculation we've used 6.2%, which is based on a levered beta of 0.800. Beta is a measure of a stock's volatility, compared to the market as a whole. We get our beta from the industry average beta of globally comparable companies, with an imposed limit between 0.8 and 2.0, which is a reasonable range for a stable business.
SWOT Analysis for Star Equity Holdings
- Currently debt free.
- Shareholders have been diluted in the past year.
- Forecast to reduce losses next year.
- Has sufficient cash runway for more than 3 years based on current free cash flows.
- Trading below our estimate of fair value by more than 20%.
- Significant insider buying over the past 3 months.
- No apparent threats visible for STRR.
Looking Ahead:
Valuation is only one side of the coin in terms of building your investment thesis, and it ideally won't be the sole piece of analysis you scrutinize for a company. It's not possible to obtain a foolproof valuation with a DCF model. Instead the best use for a DCF model is to test certain assumptions and theories to see if they would lead to the company being undervalued or overvalued. For instance, if the terminal value growth rate is adjusted slightly, it can dramatically alter the overall result. Why is the intrinsic value higher than the current share price? For Star Equity Holdings, we've put together three further aspects you should look at:
- Risks: Be aware that Star Equity Holdings is showing 4 warning signs in our investment analysis , you should know about...
- Management:Have insiders been ramping up their shares to take advantage of the market's sentiment for STRR's future outlook? Check out our management and board analysis with insights on CEO compensation and governance factors.
- Other Solid Businesses: Low debt, high returns on equity and good past performance are fundamental to a strong business. Why not explore our interactive list of stocks with solid business fundamentals to see if there are other companies you may not have considered!
PS. Simply Wall St updates its DCF calculation for every American stock every day, so if you want to find the intrinsic value of any other stock just search here.
New: Manage All Your Stock Portfolios in One Place
We've created the ultimate portfolio companion for stock investors, and it's free.
• Connect an unlimited number of Portfolios and see your total in one currency
• Be alerted to new Warning Signs or Risks via email or mobile
• Track the Fair Value of your stocks
Have feedback on this article? Concerned about the content? Get in touch with us directly. Alternatively, email editorial-team (at) simplywallst.com.
This article by Simply Wall St is general in nature. We provide commentary based on historical data and analyst forecasts only using an unbiased methodology and our articles are not intended to be financial advice. It does not constitute a recommendation to buy or sell any stock, and does not take account of your objectives, or your financial situation. We aim to bring you long-term focused analysis driven by fundamental data. Note that our analysis may not factor in the latest price-sensitive company announcements or qualitative material. Simply Wall St has no position in any stocks mentioned.
About NasdaqGM:STRR
Star Equity Holdings
A diversified holding company, engages in the construction business in the United States.
High growth potential and good value.
Similar Companies
Market Insights

Community Narratives

