

Warren Buffett famously said, 'Volatility is far from synonymous with risk.' It's only natural to consider a company's balance sheet when you examine how risky it is, since debt is often involved when a business collapses. We can see that Sight Sciences, Inc. (NASDAQ:SGHT) does use debt in its business. But should shareholders be worried about its use of debt?
Why Does Debt Bring Risk?
Generally speaking, debt only becomes a real problem when a company can't easily pay it off, either by raising capital or with its own cash flow. Ultimately, if the company can't fulfill its legal obligations to repay debt, shareholders could walk away with nothing. However, a more usual (but still expensive) situation is where a company must dilute shareholders at a cheap share price simply to get debt under control. Of course, debt can be an important tool in businesses, particularly capital heavy businesses. When we think about a company's use of debt, we first look at cash and debt together.
View our latest analysis for Sight Sciences
What Is Sight Sciences's Net Debt?
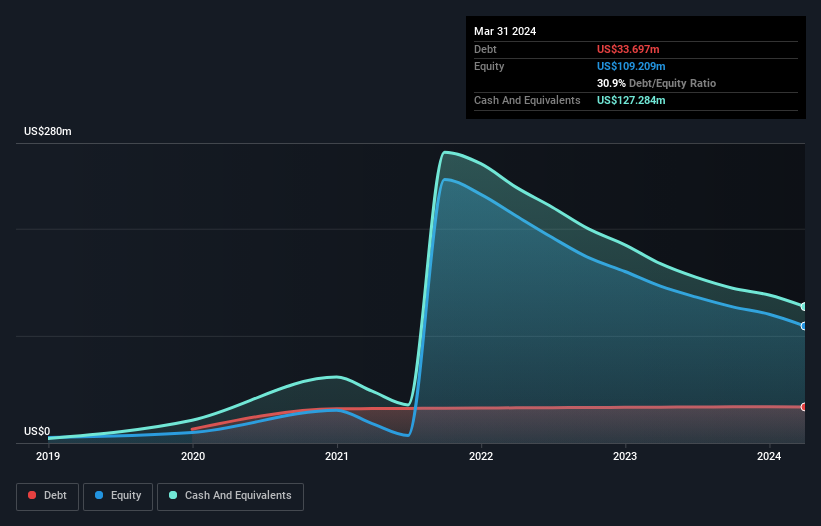
As you can see below, Sight Sciences had US$33.7m of debt, at March 2024, which is about the same as the year before. You can click the chart for greater detail. But on the other hand it also has US$127.3m in cash, leading to a US$93.6m net cash position.
How Strong Is Sight Sciences' Balance Sheet?
Zooming in on the latest balance sheet data, we can see that Sight Sciences had liabilities of US$11.7m due within 12 months and liabilities of US$34.7m due beyond that. Offsetting these obligations, it had cash of US$127.3m as well as receivables valued at US$15.6m due within 12 months. So it can boast US$96.6m more liquid assets than total liabilities.
This luscious liquidity implies that Sight Sciences' balance sheet is sturdy like a giant sequoia tree. Having regard to this fact, we think its balance sheet is as strong as an ox. Succinctly put, Sight Sciences boasts net cash, so it's fair to say it does not have a heavy debt load! When analysing debt levels, the balance sheet is the obvious place to start. But it is future earnings, more than anything, that will determine Sight Sciences's ability to maintain a healthy balance sheet going forward. So if you want to see what the professionals think, you might find this free report on analyst profit forecasts to be interesting.
Over 12 months, Sight Sciences reported revenue of US$81m, which is a gain of 8.3%, although it did not report any earnings before interest and tax. That rate of growth is a bit slow for our taste, but it takes all types to make a world.
So How Risky Is Sight Sciences?
Statistically speaking companies that lose money are riskier than those that make money. And the fact is that over the last twelve months Sight Sciences lost money at the earnings before interest and tax (EBIT) line. And over the same period it saw negative free cash outflow of US$40m and booked a US$55m accounting loss. But the saving grace is the US$93.6m on the balance sheet. That means it could keep spending at its current rate for more than two years. Even though its balance sheet seems sufficiently liquid, debt always makes us a little nervous if a company doesn't produce free cash flow regularly. When analysing debt levels, the balance sheet is the obvious place to start. However, not all investment risk resides within the balance sheet - far from it. For example - Sight Sciences has 4 warning signs we think you should be aware of.
At the end of the day, it's often better to focus on companies that are free from net debt. You can access our special list of such companies (all with a track record of profit growth). It's free.
New: Manage All Your Stock Portfolios in One Place
We've created the ultimate portfolio companion for stock investors, and it's free.
• Connect an unlimited number of Portfolios and see your total in one currency
• Be alerted to new Warning Signs or Risks via email or mobile
• Track the Fair Value of your stocks
Have feedback on this article? Concerned about the content? Get in touch with us directly. Alternatively, email editorial-team (at) simplywallst.com.
This article by Simply Wall St is general in nature. We provide commentary based on historical data and analyst forecasts only using an unbiased methodology and our articles are not intended to be financial advice. It does not constitute a recommendation to buy or sell any stock, and does not take account of your objectives, or your financial situation. We aim to bring you long-term focused analysis driven by fundamental data. Note that our analysis may not factor in the latest price-sensitive company announcements or qualitative material. Simply Wall St has no position in any stocks mentioned.
Have feedback on this article? Concerned about the content? Get in touch with us directly. Alternatively, email editorial-team@simplywallst.com
About NasdaqGS:SGHT
Sight Sciences
An ophthalmic medical device company, engages in the development and commercialization of surgical and nonsurgical technologies for the treatment of eye diseases.
Flawless balance sheet and fair value.
Similar Companies
Market Insights

Community Narratives
