
Advertisement
- United States
- /
- Healthtech
- /
- NasdaqCM:OPRX
Read This Before Judging OptimizeRx Corporation's (NASDAQ:OPRX) ROE

While some investors are already well versed in financial metrics (hat tip), this article is for those who would like to learn about Return On Equity (ROE) and why it is important. By way of learning-by-doing, we'll look at ROE to gain a better understanding of OptimizeRx Corporation (NASDAQ:OPRX).
OptimizeRx has a ROE of 2.2%, based on the last twelve months. One way to conceptualize this, is that for each $1 of shareholders' equity it has, the company made $0.022 in profit.
Want to participate in a short research study? Help shape the future of investing tools and you could win a $250 gift card!
Check out our latest analysis for OptimizeRx
How Do You Calculate Return On Equity?
The formula for return on equity is:
Return on Equity = Net Profit ÷ Shareholders' Equity
Or for OptimizeRx:
2.2% = US$422k ÷ US$19m (Based on the trailing twelve months to March 2019.)
Most know that net profit is the total earnings after all expenses, but the concept of shareholders' equity is a little more complicated. It is all earnings retained by the company, plus any capital paid in by shareholders. Shareholders' equity can be calculated by subtracting the total liabilities of the company from the total assets of the company.
What Does ROE Mean?
ROE looks at the amount a company earns relative to the money it has kept within the business. The 'return' is the profit over the last twelve months. A higher profit will lead to a higher ROE. So, all else equal, investors should like a high ROE. That means ROE can be used to compare two businesses.
Does OptimizeRx Have A Good Return On Equity?
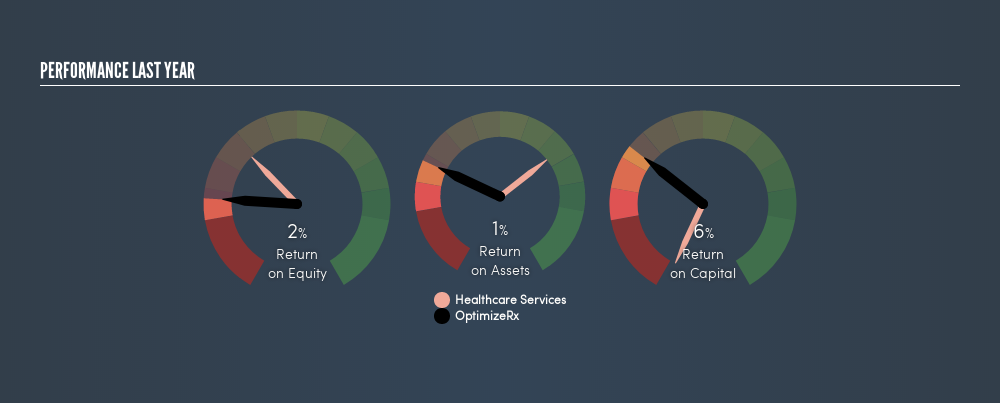
One simple way to determine if a company has a good return on equity is to compare it to the average for its industry. However, this method is only useful as a rough check, because companies do differ quite a bit within the same industry classification. As is clear from the image below, OptimizeRx has a lower ROE than the average (9.0%) in the Healthcare Services industry.
That's not what we like to see. We'd prefer see an ROE above the industry average, but it might not matter if the company is undervalued. Still, shareholders might want to check if insiders have been selling.
The Importance Of Debt To Return On Equity
Companies usually need to invest money to grow their profits. The cash for investment can come from prior year profits (retained earnings), issuing new shares, or borrowing. In the case of the first and second options, the ROE will reflect this use of cash, for growth. In the latter case, the debt used for growth will improve returns, but won't affect the total equity. That will make the ROE look better than if no debt was used.
OptimizeRx's Debt And Its 2.2% ROE
OptimizeRx has a debt to equity ratio of just 0.033, which is very low. Its ROE is rather low, and it does use some debt, albeit not much. That's not great to see. Judicious use of debt to improve returns can certainly be a good thing, although it does elevate risk slightly and reduce future optionality.
The Bottom Line On ROE
Return on equity is one way we can compare the business quality of different companies. Companies that can achieve high returns on equity without too much debt are generally of good quality. All else being equal, a higher ROE is better.
But when a business is high quality, the market often bids it up to a price that reflects this. It is important to consider other factors, such as future profit growth -- and how much investment is required going forward. So I think it may be worth checking this free report on analyst forecasts for the company.
If you would prefer check out another company -- one with potentially superior financials -- then do not miss this free list of interesting companies, that have HIGH return on equity and low debt.
We aim to bring you long-term focused research analysis driven by fundamental data. Note that our analysis may not factor in the latest price-sensitive company announcements or qualitative material.
If you spot an error that warrants correction, please contact the editor at editorial-team@simplywallst.com. This article by Simply Wall St is general in nature. It does not constitute a recommendation to buy or sell any stock, and does not take account of your objectives, or your financial situation. Simply Wall St has no position in the stocks mentioned. Thank you for reading.
About NasdaqCM:OPRX
Excellent balance sheet and overvalued.
Similar Companies
Market Insights


Advertisement
Community Narratives
The Future of Drug Testing? Fingerprint Tech Shows Serious Promise
Fair Value US$2.98|40.3% undervalued
JO
Community Contributor
Suncorp’s Next Chapter: Insurance-Only and Ready to Grow
Fair Value AU$22.83|7.9% undervalued
RO
Community Contributor
Thyssenkrupp Nucera Will Achieve Double-Digit Profits by 2030 Boosted by Hydrogen Growth
Fair Value €14.40|31.6% undervalued
CH
Community Contributor
Tesla’s Nvidia Moment – The AI & Robotics Inflection Point
Fair Value US$359.72|12.3% undervalued
BL
Community Contributor