
Advertisement
- United States
- /
- Healthtech
- /
- NasdaqCM:OPRX
Do Institutions Own OptimizeRx Corporation (NASDAQ:OPRX) Shares?

The big shareholder groups in OptimizeRx Corporation (NASDAQ:OPRX) have power over the company. Generally speaking, as a company grows, institutions will increase their ownership. Conversely, insiders often decrease their ownership over time. I quite like to see at least a little bit of insider ownership. As Charlie Munger said 'Show me the incentive and I will show you the outcome.'
OptimizeRx is not a large company by global standards. It has a market capitalization of US$131m, which means it wouldn't have the attention of many institutional investors. In the chart below below, we can see that institutional investors have bought into the company. We can zoom in on the different ownership groups, to learn more about OPRX.
View our latest analysis for OptimizeRx

What Does The Institutional Ownership Tell Us About OptimizeRx?
Institutions typically measure themselves against a benchmark when reporting to their own investors, so they often become more enthusiastic about a stock once it's included in a major index. We would expect most companies to have some institutions on the register, especially if they are growing.
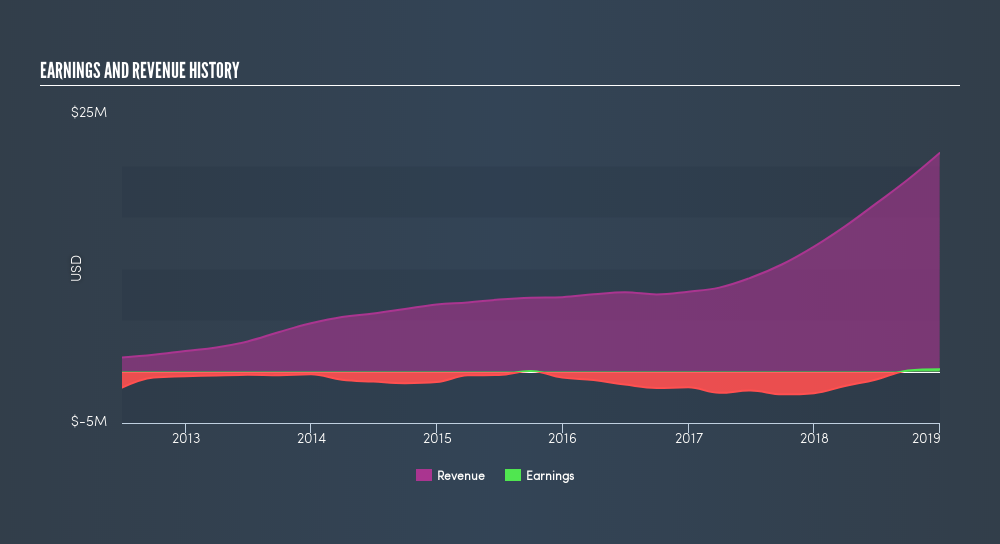
We can see that OptimizeRx does have institutional investors; and they hold 22% of the stock. This implies the analysts working for those institutions have looked at the stock and they like it. But just like anyone else, they could be wrong. When multiple institutions own a stock, there's always a risk that they are in a 'crowded trade'. When such a trade goes wrong, multiple parties may compete to sell stock fast. This risk is higher in a company without a history of growth. You can see OptimizeRx's historic earnings and revenue, below, but keep in mind there's always more to the story.
It would appear that 25% of OptimizeRx shares are controlled by hedge funds. That worth noting, since hedge funds are often quite active investors, who may try to influence management. Many want to see value creation (and a higher share price) in the short term or medium term. There are a reasonable number of analysts covering the stock, so it might be useful to find out their aggregate view on the future.
Insider Ownership Of OptimizeRx
While the precise definition of an insider can be subjective, almost everyone considers board members to be insiders. Management ultimately answers to the board. However, it is not uncommon for managers to be executive board members, especially if they are a founder or the CEO.
Most consider insider ownership a positive because it can indicate the board is well aligned with other shareholders. However, on some occasions too much power is concentrated within this group.
Our information suggests that insiders maintain a significant holding in OptimizeRx Corporation. Insiders own US$24m worth of shares in the US$131m company. This may suggest that the founders still own a lot of shares. You can click here to see if they have been buying or selling.
General Public Ownership
With a 34% ownership, the general public have some degree of sway over OPRX. This size of ownership, while considerable, may not be enough to change company policy if the decision is not in sync with other large shareholders.
Next Steps:
It's always worth thinking about the different groups who own shares in a company. But to understand OptimizeRx better, we need to consider many other factors.
I like to dive deeper into how a company has performed in the past. You can access this interactive graph of past earnings, revenue and cash flow, for free .
But ultimately it is the future, not the past, that will determine how well the owners of this business will do. Therefore we think it advisable to take a look at this free report showing whether analysts are predicting a brighter future.
NB: Figures in this article are calculated using data from the last twelve months, which refer to the 12-month period ending on the last date of the month the financial statement is dated. This may not be consistent with full year annual report figures.
We aim to bring you long-term focused research analysis driven by fundamental data. Note that our analysis may not factor in the latest price-sensitive company announcements or qualitative material.
If you spot an error that warrants correction, please contact the editor at editorial-team@simplywallst.com. This article by Simply Wall St is general in nature. It does not constitute a recommendation to buy or sell any stock, and does not take account of your objectives, or your financial situation. Simply Wall St has no position in the stocks mentioned. Thank you for reading.
About NasdaqCM:OPRX
Excellent balance sheet and overvalued.
Similar Companies
Market Insights


Advertisement
Community Narratives
The Future of Drug Testing? Fingerprint Tech Shows Serious Promise
Fair Value US$2.98|40.3% undervalued
JO
Community Contributor
Suncorp’s Next Chapter: Insurance-Only and Ready to Grow
Fair Value AU$22.83|7.9% undervalued
RO
Community Contributor
Thyssenkrupp Nucera Will Achieve Double-Digit Profits by 2030 Boosted by Hydrogen Growth
Fair Value €14.40|31.6% undervalued
CH
Community Contributor
Tesla’s Nvidia Moment – The AI & Robotics Inflection Point
Fair Value US$359.72|12.3% undervalued
BL
Community Contributor