Advertisement
- United States
- /
- Healthcare Services
- /
- NasdaqGS:OMDA
Assessing Omada Health (OMDA) Valuation After a 10% Monthly and 40% Three-Month Share Price Climb

Simply Wall St
Reviewed by Kshitija Bhandaru
Omada Health (OMDA) has caught the eye of investors recently, following a stretch of gains that pushed its stock up by about 10% over the past month and more than 40% in the past 3 months.
See our latest analysis for Omada Health.
Omada Health’s recent rally appears to be building momentum, with its 3-month share price return just shy of 42% and a one-month gain over 10%. This suggests renewed investor optimism. While near-term swings can be sharp, the latest price moves fit into a broader picture of increasing interest in the company’s growth prospects.
If you’re watching how momentum can gather around healthcare stocks, this might be the perfect time to check out other promising names: See the full list for free.
With shares climbing and estimates putting Omada Health's fair value just a notch above its latest close, the big question is whether this rally leaves room for upside or if the market is already factoring in future growth.
Price-to-Sales Ratio of 6.8x: Is it justified?
Omada Health’s stock is changing hands at a price-to-sales multiple of 6.8x, which is well above the average seen in both its peer group and the broader US healthcare sector.
The price-to-sales ratio measures how much investors are willing to pay per dollar of revenue. A higher figure can signal confidence in rapid growth or future profitability. In Omada’s case, this premium multiple suggests investors are banking on substantial forward progress, especially considering the company remains unprofitable and is not expected to turn a profit in the next three years.
However, compared to the US healthcare industry’s average price-to-sales ratio of just 1.3x, Omada Health appears notably expensive. Unless the company delivers outsized revenue growth or margin improvement, there is a risk the market could re-rate the stock lower toward sector norms over time.
See what the numbers say about this price — find out in our valuation breakdown.
Result: Price-to-Sales of 6.8x (OVERVALUED)
However, slowing revenue growth or continued losses could quickly dampen investor optimism and force a reassessment of Omada Health’s premium valuation.
Find out about the key risks to this Omada Health narrative.
Another View: SWS DCF Model Suggests Overvaluation
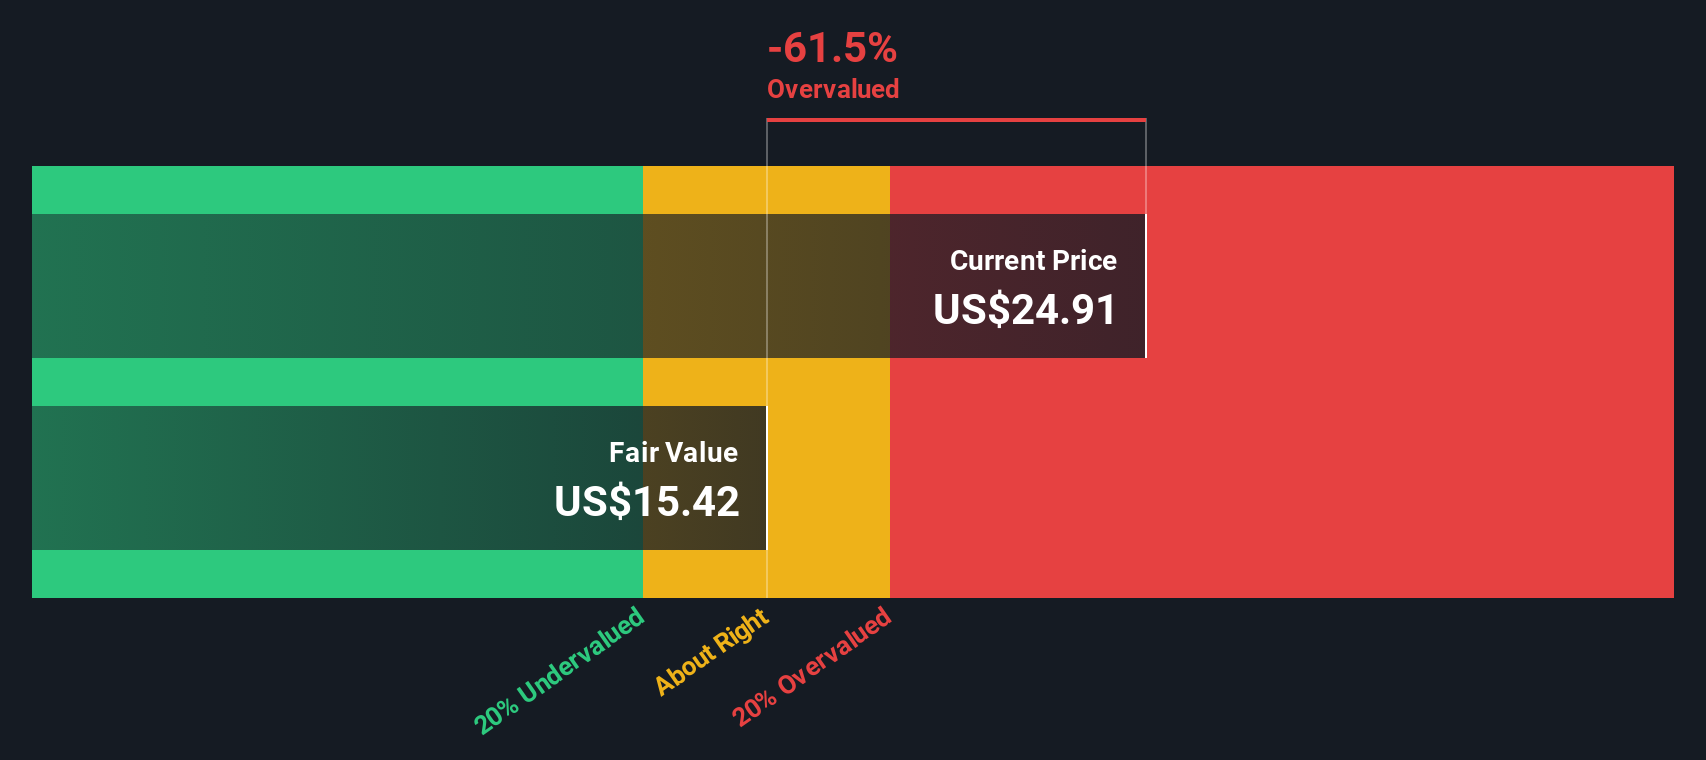
Switching to a different lens, our SWS DCF model values Omada Health shares closer to $15.42, noticeably below today’s $24.91 price. This method suggests Omada is trading above its fair value, which raises questions about whether optimism has moved too far ahead of fundamentals.
Look into how the SWS DCF model arrives at its fair value.
Simply Wall St performs a discounted cash flow (DCF) on every stock in the world every day (check out Omada Health for example). We show the entire calculation in full. You can track the result in your watchlist or portfolio and be alerted when this changes, or use our stock screener to discover undervalued stocks based on their cash flows. If you save a screener we even alert you when new companies match - so you never miss a potential opportunity.
Build Your Own Omada Health Narrative
If you want to take a different angle or rely on your own due diligence, you can easily build your own story here in just a few minutes, and Do it your way.
A great starting point for your Omada Health research is our analysis highlighting 2 key rewards and 1 important warning sign that could impact your investment decision.
Looking for more investment ideas?
Don’t let opportunity pass you by. Put the Simply Wall Street Screener to work and uncover your next great stock investment before the crowd catches on.
- Find cash-generating companies ready for a turnaround by checking out these 872 undervalued stocks based on cash flows and see which stocks trade below their true worth.
- Unlock the potential of tomorrow’s medical breakthroughs in artificial intelligence by exploring these 33 healthcare AI stocks and spot the pioneers reshaping healthcare.
- Secure steady income streams for your portfolio as you browse these 18 dividend stocks with yields > 3%, featuring high-yield opportunities with robust fundamentals.
This article by Simply Wall St is general in nature. We provide commentary based on historical data and analyst forecasts only using an unbiased methodology and our articles are not intended to be financial advice. It does not constitute a recommendation to buy or sell any stock, and does not take account of your objectives, or your financial situation. We aim to bring you long-term focused analysis driven by fundamental data. Note that our analysis may not factor in the latest price-sensitive company announcements or qualitative material. Simply Wall St has no position in any stocks mentioned.
New: AI Stock Screener & Alerts
Our new AI Stock Screener scans the market every day to uncover opportunities.
• Dividend Powerhouses (3%+ Yield)
• Undervalued Small Caps with Insider Buying
• High growth Tech and AI Companies
Or build your own from over 50 metrics.
Have feedback on this article? Concerned about the content? Get in touch with us directly. Alternatively, email editorial-team@simplywallst.com
About NasdaqGS:OMDA
Omada Health
Provides a range of virtual care programs in the United States.
Adequate balance sheet with concerning outlook.
Similar Companies
Market Insights

Advertisement
Community Narratives
Kodiak AI - a potential 100 bagger opportunity?
Fair Value US$14.00|44.7% undervalued
DA
Community Contributor
A Fair Price for a Great Business Facing Real Threats
Fair Value US$383.06|13.0% undervalued
IM
Community Contributor
AXON And Shopify Integration Will Unlock Global Mobile Advertising
Fair Value US$646.30|0% overvalued
AN
Based on Analyst Price Targets