- United States
- /
- Healthcare Services
- /
- NasdaqGS:HQY
Estimating The Intrinsic Value Of HealthEquity, Inc. (NASDAQ:HQY)


Key Insights
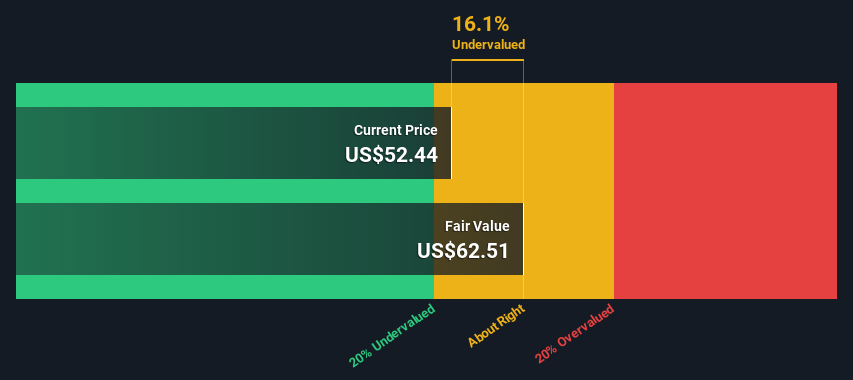
- Using the 2 Stage Free Cash Flow to Equity, HealthEquity fair value estimate is US$62.51
- Current share price of US$52.44 suggests HealthEquity is potentially trading close to its fair value
- The US$82.08 analyst price target for HQY is 31% more than our estimate of fair value
In this article we are going to estimate the intrinsic value of HealthEquity, Inc. (NASDAQ:HQY) by taking the expected future cash flows and discounting them to today's value. We will use the Discounted Cash Flow (DCF) model on this occasion. There's really not all that much to it, even though it might appear quite complex.
Remember though, that there are many ways to estimate a company's value, and a DCF is just one method. If you still have some burning questions about this type of valuation, take a look at the Simply Wall St analysis model.
See our latest analysis for HealthEquity
Crunching The Numbers
We are going to use a two-stage DCF model, which, as the name states, takes into account two stages of growth. The first stage is generally a higher growth period which levels off heading towards the terminal value, captured in the second 'steady growth' period. In the first stage we need to estimate the cash flows to the business over the next ten years. Where possible we use analyst estimates, but when these aren't available we extrapolate the previous free cash flow (FCF) from the last estimate or reported value. We assume companies with shrinking free cash flow will slow their rate of shrinkage, and that companies with growing free cash flow will see their growth rate slow, over this period. We do this to reflect that growth tends to slow more in the early years than it does in later years.
Generally we assume that a dollar today is more valuable than a dollar in the future, and so the sum of these future cash flows is then discounted to today's value:
10-year free cash flow (FCF) estimate
| 2023 | 2024 | 2025 | 2026 | 2027 | 2028 | 2029 | 2030 | 2031 | 2032 | |
| Levered FCF ($, Millions) | US$108.6m | US$178.8m | US$214.7m | US$241.2m | US$263.6m | US$282.3m | US$298.1m | US$311.6m | US$323.5m | US$334.1m |
| Growth Rate Estimate Source | Analyst x2 | Analyst x2 | Analyst x2 | Est @ 12.35% | Est @ 9.27% | Est @ 7.11% | Est @ 5.60% | Est @ 4.54% | Est @ 3.80% | Est @ 3.28% |
| Present Value ($, Millions) Discounted @ 6.9% | US$102 | US$156 | US$176 | US$184 | US$188 | US$189 | US$186 | US$182 | US$177 | US$171 |
("Est" = FCF growth rate estimated by Simply Wall St)
Present Value of 10-year Cash Flow (PVCF) = US$1.7b
We now need to calculate the Terminal Value, which accounts for all the future cash flows after this ten year period. The Gordon Growth formula is used to calculate Terminal Value at a future annual growth rate equal to the 5-year average of the 10-year government bond yield of 2.1%. We discount the terminal cash flows to today's value at a cost of equity of 6.9%.
Terminal Value (TV)= FCF2032 × (1 + g) ÷ (r – g) = US$334m× (1 + 2.1%) ÷ (6.9%– 2.1%) = US$7.0b
Present Value of Terminal Value (PVTV)= TV / (1 + r)10= US$7.0b÷ ( 1 + 6.9%)10= US$3.6b
The total value is the sum of cash flows for the next ten years plus the discounted terminal value, which results in the Total Equity Value, which in this case is US$5.3b. In the final step we divide the equity value by the number of shares outstanding. Compared to the current share price of US$52.4, the company appears about fair value at a 16% discount to where the stock price trades currently. The assumptions in any calculation have a big impact on the valuation, so it is better to view this as a rough estimate, not precise down to the last cent.
Important Assumptions
The calculation above is very dependent on two assumptions. The first is the discount rate and the other is the cash flows. If you don't agree with these result, have a go at the calculation yourself and play with the assumptions. The DCF also does not consider the possible cyclicality of an industry, or a company's future capital requirements, so it does not give a full picture of a company's potential performance. Given that we are looking at HealthEquity as potential shareholders, the cost of equity is used as the discount rate, rather than the cost of capital (or weighted average cost of capital, WACC) which accounts for debt. In this calculation we've used 6.9%, which is based on a levered beta of 0.820. Beta is a measure of a stock's volatility, compared to the market as a whole. We get our beta from the industry average beta of globally comparable companies, with an imposed limit between 0.8 and 2.0, which is a reasonable range for a stable business.
SWOT Analysis for HealthEquity
- Net debt to equity ratio below 40%.
- Interest payments on debt are not well covered.
- Expected to breakeven next year.
- Has sufficient cash runway for more than 3 years based on current free cash flows.
- Current share price is below our estimate of fair value.
- Debt is not well covered by operating cash flow.
Next Steps:
Although the valuation of a company is important, it ideally won't be the sole piece of analysis you scrutinize for a company. It's not possible to obtain a foolproof valuation with a DCF model. Instead the best use for a DCF model is to test certain assumptions and theories to see if they would lead to the company being undervalued or overvalued. For instance, if the terminal value growth rate is adjusted slightly, it can dramatically alter the overall result. For HealthEquity, we've compiled three further items you should explore:
- Risks: Be aware that HealthEquity is showing 1 warning sign in our investment analysis , you should know about...
- Future Earnings: How does HQY's growth rate compare to its peers and the wider market? Dig deeper into the analyst consensus number for the upcoming years by interacting with our free analyst growth expectation chart.
- Other Solid Businesses: Low debt, high returns on equity and good past performance are fundamental to a strong business. Why not explore our interactive list of stocks with solid business fundamentals to see if there are other companies you may not have considered!
PS. The Simply Wall St app conducts a discounted cash flow valuation for every stock on the NASDAQGS every day. If you want to find the calculation for other stocks just search here.
If you're looking to trade HealthEquity, open an account with the lowest-cost platform trusted by professionals, Interactive Brokers.
With clients in over 200 countries and territories, and access to 160 markets, IBKR lets you trade stocks, options, futures, forex, bonds and funds from a single integrated account.
Enjoy no hidden fees, no account minimums, and FX conversion rates as low as 0.03%, far better than what most brokers offer.
Sponsored ContentValuation is complex, but we're here to simplify it.
Discover if HealthEquity might be undervalued or overvalued with our detailed analysis, featuring fair value estimates, potential risks, dividends, insider trades, and its financial condition.
Access Free AnalysisHave feedback on this article? Concerned about the content? Get in touch with us directly. Alternatively, email editorial-team (at) simplywallst.com.
This article by Simply Wall St is general in nature. We provide commentary based on historical data and analyst forecasts only using an unbiased methodology and our articles are not intended to be financial advice. It does not constitute a recommendation to buy or sell any stock, and does not take account of your objectives, or your financial situation. We aim to bring you long-term focused analysis driven by fundamental data. Note that our analysis may not factor in the latest price-sensitive company announcements or qualitative material. Simply Wall St has no position in any stocks mentioned.
About NasdaqGS:HQY
HealthEquity
Provides technology-enabled services platforms to consumers and employers in the United States.
Excellent balance sheet with reasonable growth potential.

