
Advertisement
- United States
- /
- Healthtech
- /
- NasdaqCM:FORA
Unpleasant Surprises Could Be In Store For Forian Inc.'s (NASDAQ:FORA) Shares
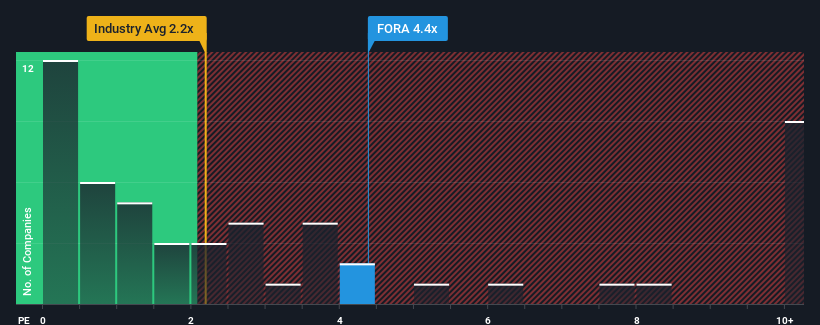
Forian Inc.'s (NASDAQ:FORA) price-to-sales (or "P/S") ratio of 4.4x may look like a poor investment opportunity when you consider close to half the companies in the Healthcare Services industry in the United States have P/S ratios below 2.2x. Although, it's not wise to just take the P/S at face value as there may be an explanation why it's so lofty.
View our latest analysis for Forian
What Does Forian's Recent Performance Look Like?
Recent times have been advantageous for Forian as its revenues have been rising faster than most other companies. It seems that many are expecting the strong revenue performance to persist, which has raised the P/S. However, if this isn't the case, investors might get caught out paying too much for the stock.
Want the full picture on analyst estimates for the company? Then our free report on Forian will help you uncover what's on the horizon.Is There Enough Revenue Growth Forecasted For Forian?
Forian's P/S ratio would be typical for a company that's expected to deliver very strong growth, and importantly, perform much better than the industry.
Taking a look back first, we see that the company grew revenue by an impressive 25% last year. Spectacularly, three year revenue growth has ballooned by several orders of magnitude, thanks in part to the last 12 months of revenue growth. Accordingly, shareholders would have been over the moon with those medium-term rates of revenue growth.
Turning to the outlook, the next year should generate growth of 13% as estimated by the two analysts watching the company. With the industry predicted to deliver 13% growth , the company is positioned for a comparable revenue result.
With this information, we find it interesting that Forian is trading at a high P/S compared to the industry. It seems most investors are ignoring the fairly average growth expectations and are willing to pay up for exposure to the stock. These shareholders may be setting themselves up for disappointment if the P/S falls to levels more in line with the growth outlook.
What Does Forian's P/S Mean For Investors?
Using the price-to-sales ratio alone to determine if you should sell your stock isn't sensible, however it can be a practical guide to the company's future prospects.
Seeing as its revenues are forecast to grow in line with the wider industry, it would appear that Forian currently trades on a higher than expected P/S. Right now we are uncomfortable with the relatively high share price as the predicted future revenues aren't likely to support such positive sentiment for long. A positive change is needed in order to justify the current price-to-sales ratio.
It is also worth noting that we have found 4 warning signs for Forian (1 doesn't sit too well with us!) that you need to take into consideration.
Of course, profitable companies with a history of great earnings growth are generally safer bets. So you may wish to see this free collection of other companies that have reasonable P/E ratios and have grown earnings strongly.
New: AI Stock Screener & Alerts
Our new AI Stock Screener scans the market every day to uncover opportunities.
• Dividend Powerhouses (3%+ Yield)
• Undervalued Small Caps with Insider Buying
• High growth Tech and AI Companies
Or build your own from over 50 metrics.
Have feedback on this article? Concerned about the content? Get in touch with us directly. Alternatively, email editorial-team (at) simplywallst.com.
This article by Simply Wall St is general in nature. We provide commentary based on historical data and analyst forecasts only using an unbiased methodology and our articles are not intended to be financial advice. It does not constitute a recommendation to buy or sell any stock, and does not take account of your objectives, or your financial situation. We aim to bring you long-term focused analysis driven by fundamental data. Note that our analysis may not factor in the latest price-sensitive company announcements or qualitative material. Simply Wall St has no position in any stocks mentioned.
About NasdaqCM:FORA
Forian
Provides a suite of data management capabilities, and information and analytics solutions to optimize and measure operational, clinical, and financial performance for customers in the life science, healthcare, and financial services industries.
Flawless balance sheet with very low risk.
Similar Companies
Market Insights

Advertisement
Weekly Picks
RO


RockeTeller on Santacruz Silver Mining ·
Crazy Undervalued 42 Baggers Silver Play (Active & Running Mine)
Fair Value:CA$8696.7% undervalued
75 followersusers have followed this narrative
7 commentsusers have commented on this narrative
21 likesusers have liked this narrative
RO


Robbo on Fiducian Group ·
Fiducian: Compliance Clouds or Value Opportunity?
Fair Value:AU$121.2% undervalued
13 followersusers have followed this narrative
0 commentsusers have commented on this narrative
1 likeusers have liked this narrative
WO

woodworthfund on Willamette Valley Vineyards ·
Willamette Valley Vineyards (WVVI): Not-So-Great Value
Fair Value:US$245.0% overvalued
11 followersusers have followed this narrative
0 commentsusers have commented on this narrative
1 likeusers have liked this narrative
Recently Updated Narratives
NO

Norms70 on Standard Lithium ·
SLI is share to watch next 5 years
Fair Value:€4.59.8% undervalued
1 followerusers have followed this narrative
0 commentsusers have commented on this narrative
0 likesusers have liked this narrative
DA


davidlsander on Beam Therapeutics ·
The "Molecular Pencil": Why Beam's Technology is Built to Win
Fair Value:US$15081.9% undervalued
60 followersusers have followed this narrative
3 commentsusers have commented on this narrative
0 likesusers have liked this narrative
RE

RedhawkCC on Prime Medicine ·
PRME remains a long shot but publication in the New England Journal of Medicine helps.
Fair Value:US$0.0469.1k% overvalued
1 followerusers have followed this narrative
0 commentsusers have commented on this narrative
0 likesusers have liked this narrative
Popular Narratives
TH


TheWallstreetKing on MicroVision ·
MicroVision will explode future revenue by 380.37% with a vision towards success
Fair Value:US$6098.5% undervalued
118 followersusers have followed this narrative
11 commentsusers have commented on this narrative
22 likesusers have liked this narrative
AN


AnalystConsensusTarget on NVIDIA ·
NVDA: Expanding AI Demand Will Drive Major Data Center Investments Through 2026
Fair Value:US$250.3925.9% undervalued
962 followersusers have followed this narrative
6 commentsusers have commented on this narrative
25 likesusers have liked this narrative
RO
RockeTeller on Santacruz Silver Mining ·
Crazy Undervalued 42 Baggers Silver Play (Active & Running Mine)
Fair Value:CA$8696.7% undervalued
75 followersusers have followed this narrative
7 commentsusers have commented on this narrative
21 likesusers have liked this narrative
