
Advertisement
- United States
- /
- Healthcare Services
- /
- NasdaqGS:ENSG
Does Ensign Group (NASDAQ:ENSG) Have A Healthy Balance Sheet?

Warren Buffett famously said, 'Volatility is far from synonymous with risk.' When we think about how risky a company is, we always like to look at its use of debt, since debt overload can lead to ruin. We note that The Ensign Group, Inc. (NASDAQ:ENSG) does have debt on its balance sheet. But should shareholders be worried about its use of debt?
When Is Debt Dangerous?
Debt is a tool to help businesses grow, but if a business is incapable of paying off its lenders, then it exists at their mercy. If things get really bad, the lenders can take control of the business. However, a more frequent (but still costly) occurrence is where a company must issue shares at bargain-basement prices, permanently diluting shareholders, just to shore up its balance sheet. Of course, the upside of debt is that it often represents cheap capital, especially when it replaces dilution in a company with the ability to reinvest at high rates of return. When we examine debt levels, we first consider both cash and debt levels, together.
Check out our latest analysis for Ensign Group
What Is Ensign Group's Debt?
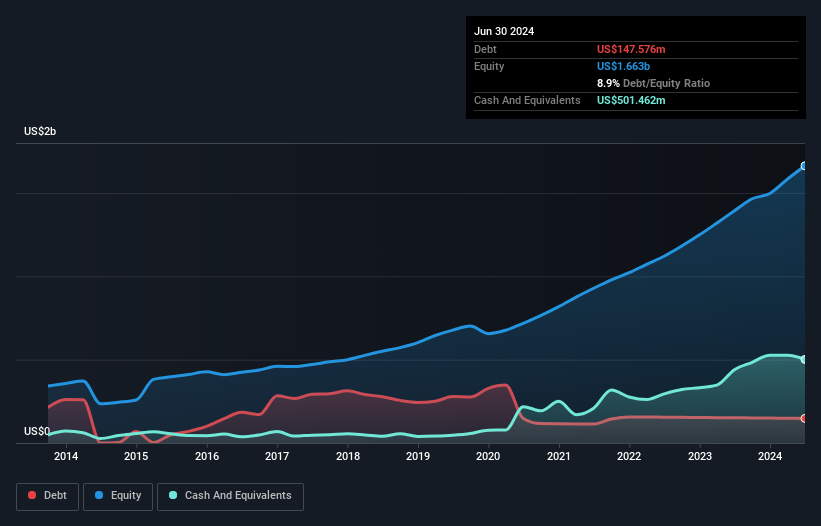
As you can see below, Ensign Group had US$147.6m of debt, at June 2024, which is about the same as the year before. You can click the chart for greater detail. But it also has US$501.5m in cash to offset that, meaning it has US$353.9m net cash.
A Look At Ensign Group's Liabilities
Zooming in on the latest balance sheet data, we can see that Ensign Group had liabilities of US$730.8m due within 12 months and liabilities of US$2.04b due beyond that. Offsetting these obligations, it had cash of US$501.5m as well as receivables valued at US$547.1m due within 12 months. So its liabilities outweigh the sum of its cash and (near-term) receivables by US$1.73b.
Ensign Group has a market capitalization of US$8.10b, so it could very likely raise cash to ameliorate its balance sheet, if the need arose. But it's clear that we should definitely closely examine whether it can manage its debt without dilution. Despite its noteworthy liabilities, Ensign Group boasts net cash, so it's fair to say it does not have a heavy debt load!
But the bad news is that Ensign Group has seen its EBIT plunge 10% in the last twelve months. We think hat kind of performance, if repeated frequently, could well lead to difficulties for the stock. The balance sheet is clearly the area to focus on when you are analysing debt. But it is future earnings, more than anything, that will determine Ensign Group's ability to maintain a healthy balance sheet going forward. So if you're focused on the future you can check out this free report showing analyst profit forecasts.
Finally, a company can only pay off debt with cold hard cash, not accounting profits. While Ensign Group has net cash on its balance sheet, it's still worth taking a look at its ability to convert earnings before interest and tax (EBIT) to free cash flow, to help us understand how quickly it is building (or eroding) that cash balance. In the last three years, Ensign Group's free cash flow amounted to 38% of its EBIT, less than we'd expect. That weak cash conversion makes it more difficult to handle indebtedness.
Summing Up
While Ensign Group does have more liabilities than liquid assets, it also has net cash of US$353.9m. So we are not troubled with Ensign Group's debt use. Over time, share prices tend to follow earnings per share, so if you're interested in Ensign Group, you may well want to click here to check an interactive graph of its earnings per share history.
If, after all that, you're more interested in a fast growing company with a rock-solid balance sheet, then check out our list of net cash growth stocks without delay.
Valuation is complex, but we're here to simplify it.
Discover if Ensign Group might be undervalued or overvalued with our detailed analysis, featuring fair value estimates, potential risks, dividends, insider trades, and its financial condition.
Access Free AnalysisHave feedback on this article? Concerned about the content? Get in touch with us directly. Alternatively, email editorial-team (at) simplywallst.com.
This article by Simply Wall St is general in nature. We provide commentary based on historical data and analyst forecasts only using an unbiased methodology and our articles are not intended to be financial advice. It does not constitute a recommendation to buy or sell any stock, and does not take account of your objectives, or your financial situation. We aim to bring you long-term focused analysis driven by fundamental data. Note that our analysis may not factor in the latest price-sensitive company announcements or qualitative material. Simply Wall St has no position in any stocks mentioned.
Have feedback on this article? Concerned about the content? Get in touch with us directly. Alternatively, email editorial-team@simplywallst.com
About NasdaqGS:ENSG
Ensign Group
Provides skilled nursing, senior living, and rehabilitative services.
Solid track record with excellent balance sheet.
Similar Companies
Market Insights

Advertisement
Community Narratives
Pinterest will surge as advertising innovations ignite revenue growth
Fair Value US$42.63|27.0% undervalued
BR
Community Contributor
Brambles' Revenue Set to Climb 14% with Profit Margins Following
Fair Value AU$21.90|5.9% overvalued
RO
Community Contributor
Challenging Future for STG as Organic Sales Decline by 8.8%
Fair Value DKK 116.13|26.8% undervalued
KA
Community Contributor