- United States
- /
- Medical Equipment
- /
- NasdaqCM:CHEK
We're Keeping An Eye On Check-Cap's (NASDAQ:CHEK) Cash Burn Rate
Just because a business does not make any money, does not mean that the stock will go down. For example, although software-as-a-service business Salesforce.com lost money for years while it grew recurring revenue, if you held shares since 2005, you'd have done very well indeed. But while history lauds those rare successes, those that fail are often forgotten; who remembers Pets.com?
So should Check-Cap (NASDAQ:CHEK) shareholders be worried about its cash burn? In this report, we will consider the company's annual negative free cash flow, henceforth referring to it as the 'cash burn'. We'll start by comparing its cash burn with its cash reserves in order to calculate its cash runway.
See our latest analysis for Check-Cap
How Long Is Check-Cap's Cash Runway?
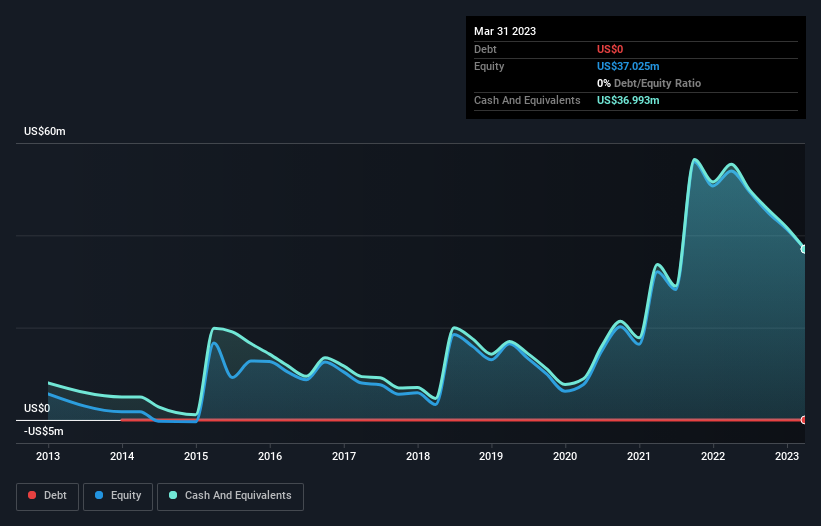
A company's cash runway is calculated by dividing its cash hoard by its cash burn. When Check-Cap last reported its balance sheet in March 2023, it had zero debt and cash worth US$37m. In the last year, its cash burn was US$19m. Therefore, from March 2023 it had 2.0 years of cash runway. While that cash runway isn't too concerning, sensible holders would be peering into the distance, and considering what happens if the company runs out of cash. The image below shows how its cash balance has been changing over the last few years.

How Is Check-Cap's Cash Burn Changing Over Time?
Because Check-Cap isn't currently generating revenue, we consider it an early-stage business. So while we can't look to sales to understand growth, we can look at how the cash burn is changing to understand how expenditure is trending over time. It seems likely that the business is content with its current spending, as the cash burn rate stayed steady over the last twelve months. While the past is always worth studying, it is the future that matters most of all. So you might want to take a peek at how much the company is expected to grow in the next few years.
How Hard Would It Be For Check-Cap To Raise More Cash For Growth?
While Check-Cap is showing a solid reduction in its cash burn, it's still worth considering how easily it could raise more cash, even just to fuel faster growth. Issuing new shares, or taking on debt, are the most common ways for a listed company to raise more money for its business. One of the main advantages held by publicly listed companies is that they can sell shares to investors to raise cash and fund growth. We can compare a company's cash burn to its market capitalisation to get a sense for how many new shares a company would have to issue to fund one year's operations.
Check-Cap's cash burn of US$19m is about 93% of its US$20m market capitalisation. That suggests the company may have some funding difficulties, and we'd be very wary of the stock.
How Risky Is Check-Cap's Cash Burn Situation?
Even though its cash burn relative to its market cap makes us a little nervous, we are compelled to mention that we thought Check-Cap's cash runway was relatively promising. Summing up, we think the Check-Cap's cash burn is a risk, based on the factors we mentioned in this article. Taking a deeper dive, we've spotted 4 warning signs for Check-Cap you should be aware of, and 1 of them doesn't sit too well with us.
Of course Check-Cap may not be the best stock to buy. So you may wish to see this free collection of companies boasting high return on equity, or this list of stocks that insiders are buying.
New: AI Stock Screener & Alerts
Our new AI Stock Screener scans the market every day to uncover opportunities.
• Dividend Powerhouses (3%+ Yield)
• Undervalued Small Caps with Insider Buying
• High growth Tech and AI Companies
Or build your own from over 50 metrics.
Have feedback on this article? Concerned about the content? Get in touch with us directly. Alternatively, email editorial-team (at) simplywallst.com.
This article by Simply Wall St is general in nature. We provide commentary based on historical data and analyst forecasts only using an unbiased methodology and our articles are not intended to be financial advice. It does not constitute a recommendation to buy or sell any stock, and does not take account of your objectives, or your financial situation. We aim to bring you long-term focused analysis driven by fundamental data. Note that our analysis may not factor in the latest price-sensitive company announcements or qualitative material. Simply Wall St has no position in any stocks mentioned.
About NasdaqCM:CHEK
Check-Cap
A clinical stage medical diagnostics company, focuses on capsule-based screening technology products.
Moderate risk with worrying balance sheet.
Market Insights
Community Narratives


Recently Updated Narratives

Astor Enerji will surge with a fair value of $140.43 in the next 3 years

Proximus: The State-Backed Backup Plan with 7% Gross Yield and 15% Currency Upside.


A case for for IMPACT Silver Corp (TSXV:IPT) to reach USD $4.52 (CAD $6.16) in 2026 (23 bagger in 1 year) and USD $5.76 (CAD $7.89) by 2030
Popular Narratives


MicroVision will explode future revenue by 380.37% with a vision towards success


The company that turned a verb into a global necessity and basically runs the modern internet, digital ads, smartphones, maps, and AI.


