- United States
- /
- Healthcare Services
- /
- NasdaqGS:CCRN
These 4 Measures Indicate That Cross Country Healthcare (NASDAQ:CCRN) Is Using Debt Reasonably Well


Warren Buffett famously said, 'Volatility is far from synonymous with risk.' So it seems the smart money knows that debt - which is usually involved in bankruptcies - is a very important factor, when you assess how risky a company is. We note that Cross Country Healthcare, Inc. (NASDAQ:CCRN) does have debt on its balance sheet. But should shareholders be worried about its use of debt?
When Is Debt A Problem?
Generally speaking, debt only becomes a real problem when a company can't easily pay it off, either by raising capital or with its own cash flow. Part and parcel of capitalism is the process of 'creative destruction' where failed businesses are mercilessly liquidated by their bankers. However, a more usual (but still expensive) situation is where a company must dilute shareholders at a cheap share price simply to get debt under control. By replacing dilution, though, debt can be an extremely good tool for businesses that need capital to invest in growth at high rates of return. When we examine debt levels, we first consider both cash and debt levels, together.
See our latest analysis for Cross Country Healthcare
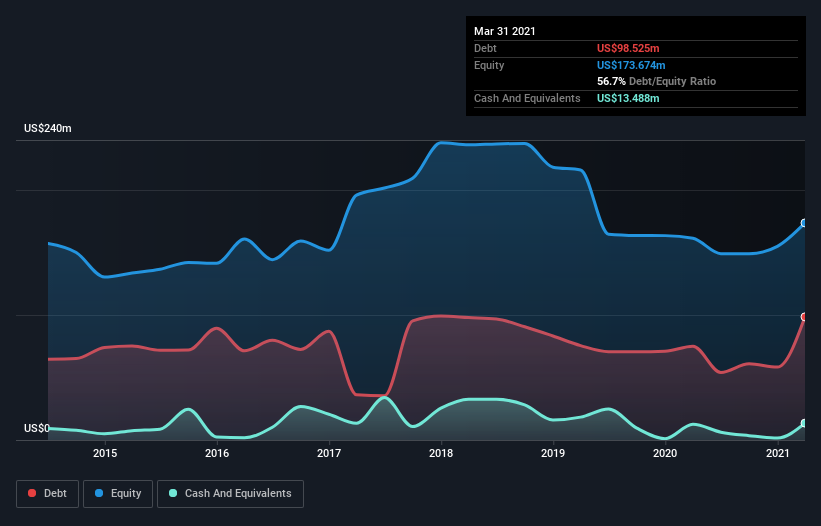
How Much Debt Does Cross Country Healthcare Carry?
The image below, which you can click on for greater detail, shows that at March 2021 Cross Country Healthcare had debt of US$98.5m, up from US$74.9m in one year. However, because it has a cash reserve of US$13.5m, its net debt is less, at about US$85.0m.
How Strong Is Cross Country Healthcare's Balance Sheet?
Zooming in on the latest balance sheet data, we can see that Cross Country Healthcare had liabilities of US$121.7m due within 12 months and liabilities of US$147.0m due beyond that. Offsetting this, it had US$13.5m in cash and US$250.2m in receivables that were due within 12 months. So these liquid assets roughly match the total liabilities.
Having regard to Cross Country Healthcare's size, it seems that its liquid assets are well balanced with its total liabilities. So it's very unlikely that the US$629.4m company is short on cash, but still worth keeping an eye on the balance sheet.
In order to size up a company's debt relative to its earnings, we calculate its net debt divided by its earnings before interest, tax, depreciation, and amortization (EBITDA) and its earnings before interest and tax (EBIT) divided by its interest expense (its interest cover). This way, we consider both the absolute quantum of the debt, as well as the interest rates paid on it.
We'd say that Cross Country Healthcare's moderate net debt to EBITDA ratio ( being 1.8), indicates prudence when it comes to debt. And its strong interest cover of 14.1 times, makes us even more comfortable. Pleasingly, Cross Country Healthcare is growing its EBIT faster than former Australian PM Bob Hawke downs a yard glass, boasting a 263% gain in the last twelve months. When analysing debt levels, the balance sheet is the obvious place to start. But it is future earnings, more than anything, that will determine Cross Country Healthcare's ability to maintain a healthy balance sheet going forward. So if you're focused on the future you can check out this free report showing analyst profit forecasts.
Finally, a company can only pay off debt with cold hard cash, not accounting profits. So the logical step is to look at the proportion of that EBIT that is matched by actual free cash flow. Over the last three years, Cross Country Healthcare reported free cash flow worth 5.7% of its EBIT, which is really quite low. That limp level of cash conversion undermines its ability to manage and pay down debt.
Our View
The good news is that Cross Country Healthcare's demonstrated ability to cover its interest expense with its EBIT delights us like a fluffy puppy does a toddler. But the stark truth is that we are concerned by its conversion of EBIT to free cash flow. We would also note that Healthcare industry companies like Cross Country Healthcare commonly do use debt without problems. When we consider the range of factors above, it looks like Cross Country Healthcare is pretty sensible with its use of debt. While that brings some risk, it can also enhance returns for shareholders. There's no doubt that we learn most about debt from the balance sheet. However, not all investment risk resides within the balance sheet - far from it. We've identified 5 warning signs with Cross Country Healthcare (at least 2 which are a bit concerning) , and understanding them should be part of your investment process.
At the end of the day, it's often better to focus on companies that are free from net debt. You can access our special list of such companies (all with a track record of profit growth). It's free.
When trading Cross Country Healthcare or any other investment, use the platform considered by many to be the Professional's Gateway to the Worlds Market, Interactive Brokers. You get the lowest-cost* trading on stocks, options, futures, forex, bonds and funds worldwide from a single integrated account. Promoted
If you're looking to trade Cross Country Healthcare, open an account with the lowest-cost platform trusted by professionals, Interactive Brokers.
With clients in over 200 countries and territories, and access to 160 markets, IBKR lets you trade stocks, options, futures, forex, bonds and funds from a single integrated account.
Enjoy no hidden fees, no account minimums, and FX conversion rates as low as 0.03%, far better than what most brokers offer.
Sponsored ContentNew: AI Stock Screener & Alerts
Our new AI Stock Screener scans the market every day to uncover opportunities.
• Dividend Powerhouses (3%+ Yield)
• Undervalued Small Caps with Insider Buying
• High growth Tech and AI Companies
Or build your own from over 50 metrics.
This article by Simply Wall St is general in nature. It does not constitute a recommendation to buy or sell any stock, and does not take account of your objectives, or your financial situation. We aim to bring you long-term focused analysis driven by fundamental data. Note that our analysis may not factor in the latest price-sensitive company announcements or qualitative material. Simply Wall St has no position in any stocks mentioned.
*Interactive Brokers Rated Lowest Cost Broker by StockBrokers.com Annual Online Review 2020
Have feedback on this article? Concerned about the content? Get in touch with us directly. Alternatively, email editorial-team (at) simplywallst.com.
About NasdaqGS:CCRN
Cross Country Healthcare
Provides talent management services for healthcare clients in the United States.
Flawless balance sheet and fair value.
Similar Companies
Market Insights

Community Narratives

