
Advertisement
- United States
- /
- Medical Equipment
- /
- NasdaqCM:BJDX
Is Bluejay Diagnostics (NASDAQ:BJDX) In A Good Position To Invest In Growth?

There's no doubt that money can be made by owning shares of unprofitable businesses. For example, although Amazon.com made losses for many years after listing, if you had bought and held the shares since 1999, you would have made a fortune. But while history lauds those rare successes, those that fail are often forgotten; who remembers Pets.com?
So, the natural question for Bluejay Diagnostics (NASDAQ:BJDX) shareholders is whether they should be concerned by its rate of cash burn. In this article, we define cash burn as its annual (negative) free cash flow, which is the amount of money a company spends each year to fund its growth. Let's start with an examination of the business' cash, relative to its cash burn.
Check out our latest analysis for Bluejay Diagnostics
When Might Bluejay Diagnostics Run Out Of Money?
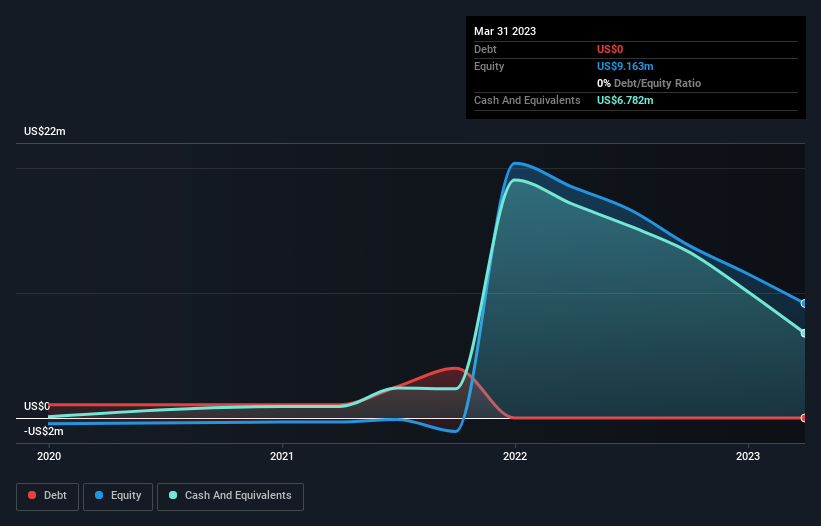
A company's cash runway is the amount of time it would take to burn through its cash reserves at its current cash burn rate. In March 2023, Bluejay Diagnostics had US$6.8m in cash, and was debt-free. Looking at the last year, the company burnt through US$10m. So it had a cash runway of approximately 8 months from March 2023. To be frank, this kind of short runway puts us on edge, as it indicates the company must reduce its cash burn significantly, or else raise cash imminently. You can see how its cash balance has changed over time in the image below.
How Is Bluejay Diagnostics' Cash Burn Changing Over Time?
Whilst it's great to see that Bluejay Diagnostics has already begun generating revenue from operations, last year it only produced US$249k, so we don't think it is generating significant revenue, at this point. As a result, we think it's a bit early to focus on the revenue growth, so we'll limit ourselves to looking at how the cash burn is changing over time. Over the last year its cash burn actually increased by a very significant 73%. While this spending increase is no doubt intended to drive growth, if the trend continues the company's cash runway will shrink very quickly. Clearly, however, the crucial factor is whether the company will grow its business going forward. For that reason, it makes a lot of sense to take a look at our analyst forecasts for the company.
How Easily Can Bluejay Diagnostics Raise Cash?
Since its cash burn is moving in the wrong direction, Bluejay Diagnostics shareholders may wish to think ahead to when the company may need to raise more cash. Issuing new shares, or taking on debt, are the most common ways for a listed company to raise more money for its business. Many companies end up issuing new shares to fund future growth. By looking at a company's cash burn relative to its market capitalisation, we gain insight on how much shareholders would be diluted if the company needed to raise enough cash to cover another year's cash burn.
Bluejay Diagnostics has a market capitalisation of US$124m and burnt through US$10m last year, which is 8.3% of the company's market value. That's a low proportion, so we figure the company would be able to raise more cash to fund growth, with a little dilution, or even to simply borrow some money.
Is Bluejay Diagnostics' Cash Burn A Worry?
On this analysis of Bluejay Diagnostics' cash burn, we think its cash burn relative to its market cap was reassuring, while its cash runway has us a bit worried. Summing up, we think the Bluejay Diagnostics' cash burn is a risk, based on the factors we mentioned in this article. On another note, Bluejay Diagnostics has 4 warning signs (and 3 which are a bit unpleasant) we think you should know about.
Of course, you might find a fantastic investment by looking elsewhere. So take a peek at this free list of interesting companies, and this list of stocks growth stocks (according to analyst forecasts)
Valuation is complex, but we're here to simplify it.
Discover if Bluejay Diagnostics might be undervalued or overvalued with our detailed analysis, featuring fair value estimates, potential risks, dividends, insider trades, and its financial condition.
Access Free AnalysisHave feedback on this article? Concerned about the content? Get in touch with us directly. Alternatively, email editorial-team (at) simplywallst.com.
This article by Simply Wall St is general in nature. We provide commentary based on historical data and analyst forecasts only using an unbiased methodology and our articles are not intended to be financial advice. It does not constitute a recommendation to buy or sell any stock, and does not take account of your objectives, or your financial situation. We aim to bring you long-term focused analysis driven by fundamental data. Note that our analysis may not factor in the latest price-sensitive company announcements or qualitative material. Simply Wall St has no position in any stocks mentioned.
About NasdaqCM:BJDX
Medium-low with adequate balance sheet.
Market Insights

Advertisement
Community Narratives
The Most Undervalued of the Magnificent 7
Fair Value US$237.43|36.3% undervalued
IN
Community Contributor
PVA TePla's New Strategy Aims for 22% Revenue Growth in Semiconductor Recovery
Fair Value €19.19|20.8% undervalued
MI
Community Contributor